ECharts柱状图、折线图、雷达图、饼图
自己理解的,不一定正确,只有模拟数据,仅供参考
柱状图
1、引入js
js直接在官网下载
<%-- 使用雷达图,要引入的js --%>
2、页面简单设计
3、Js 设计
<script type="text/javascript">
        $(document).ready(function () {

            // 获取div的id,基于准备好的dom,初始化echarts实例
            var myChart1 = echarts.init(document.getElementById('t1'));

            // 指定图表的配置项和数据
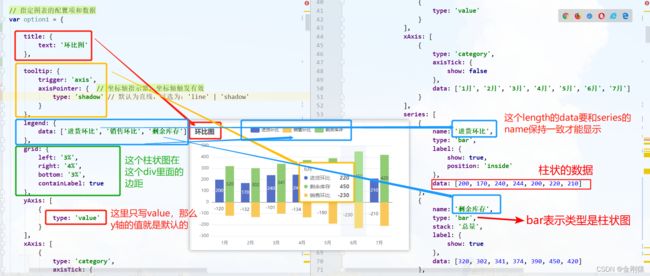
            var option1 = {
                title: {
                    text: '环比图'
                },
                tooltip: {
                    trigger: 'axis',
                    axisPointer: {            // 坐标轴指示器,坐标轴触发有效
                        type: 'shadow'        // 默认为直线,可选为:'line' | 'shadow'
                    }
                },
                legend: {
                    data: ['进货环比', '销售环比', '剩余库存']
                },
                grid: {
                    left: '3%',
                    right: '4%',
                    bottom: '3%',
                    containLabel: true
                },
                yAxis: [
                    {
                        type: 'value'
                    }
                ],
                xAxis: [
                    {
                        type: 'category',
                        axisTick: {
                            show: false
                        },
                        data: ['1月', '2月', '3月', '4月', '5月', '6月', '7月']
                    }
                ],
                series: [
                    {
                        name: '进货环比',
                        type: 'bar',
                        label: {
                            show: true,
                            position: 'inside'
                        },
                        data: [200, 170, 240, 244, 200, 220, 210]
                    },
                    {
                        name: '剩余库存',
                        type: 'bar',
                        stack: '总量',
                        label: {
                            show: true
                        },
                        data: [320, 302, 341, 374, 390, 450, 420]
                    },
                    {
                        name: '销售环比',
                        type: 'bar',
                        stack: '总量',
                        label: {
                            show: true,
                            position: 'left'
                        },
                        data: [-120, -132, -101, -134, -190, -230, -210]
                    }
                ]
            };

            // 使用刚指定的配置项和数据显示图表。
            myChart1.setOption(option1);
  });
 </script>
柱状图&折线图
 // 基于准备好的dom,初始化echarts实例
            var myChart2 = echarts.init(document.getElementById('t2'));

            // 指定图表的配置项和数据
            var option2 = {
                //tooltip  提示框组件
                tooltip: {
                    trigger: 'axis',
                    axisPointer: {
                        type: 'cross',
                        crossStyle: {
                            color: '#999'
                        }
                    }
                },
                //数据视图、切换为折线图、切换为柱状图、还原功能、保存图片功能
                toolbox: {
                    feature: {
                        dataView: {show: true, readOnly: false},
                        magicType: {show: true, type: ['bar']},
                        restore: {show: true},
                        saveAsImage: {show: true}
                    }
                },
                //legend 图例组件
                legend: {
                    data: ['进货', '销售']
                },
                //左右距离
                grid: {
                    left: '13%',
                    right: '4%',
                    containLabel: true
                },
                //x轴数据
                xAxis: [
                    {
                        type: 'category',
                        data: ['1月', '2月', '3月', '4月', '5月', '6月', '7月', '8月', '9月', '10月', '11月', '12月'],
                        //axisPointer  坐标轴指示器   是指示坐标轴当前刻度的工具
                        axisPointer: {
                            type: 'shadow'
                        }
                    }
                ],
                //y轴数据
                yAxis: [
                    {
                        type: 'value',
                        name: '进货/万元',
                        min: 0,
                        max: 300,
                        interval: 50,
                        axisLabel: {
                            formatter: '{value}'
                        }
                    }
                    ,
                    {
                        type: 'value',
                        name: '销售/万元',
                        min: 0,
                        max: 300,
                        interval: 50,
                        axisLabel: {
                            formatter: '{value}'
                        }
                    }
                ],
                //对应要显示的数据,一般把后端转成成json格式传过来   bar柱状图   line折线图
                series: [
                    {
                        name: '进货',
                        type: 'bar',
                        //每个柱状图顶部显示具体数据
                        label: {
                            normal: {
                                show: true,
                                position: 'top'
                            }
                        },
                        data: [12.0, 4.9, 7.0, 23.2, 25.6, 76.7, 135.6, 162.2, 32.6, 20.0, 6.4, 3.3]
                    }
                    ,
                    {
                        name: '销售',
                        type: 'line',
                        yAxisIndex: 1,
                        //每个节点显示具体数据
                        label: {
                            normal: {
                                show: true,
                                position: 'top'
                            }
                        },
                        data: [2.0, 12.2, 13.3, 4.5, 6.3, 110.2, 20.3, 23.4, 23.0, 116.5, 12.0, 6.2]
                    }
                ]
            };

            // 使用刚指定的配置项和数据显示图表。
            myChart2.setOption(option2);
柱状图
 var myChart3 = echarts.init(document.getElementById('t3'));

            // 指定图表的配置项和数据
            var option3 = {

                title: {
                    text: '销售排行榜'

                },
                tooltip: {
                    trigger: 'axis',
                    axisPointer: {
                        type: 'shadow'
                    }
                },
                legend: {
                    data: ['排行榜']
                },
                grid: {
                    left: '3%',
                    right: '4%',
                    bottom: '3%',
                    containLabel: true
                },
                xAxis: {
                    type: 'value'
                },
                yAxis: [{
                    type: 'category',
                    data: ['产品18号', '产品18号', '产品18号', '产品18号', '产品18号', '产品18号', '产品18号', '产品18号', '产品18号', '产品18号', '产品18号', '产品18号']
                },
                    {
                        type: 'category',
                        data: ['第12名', '第11名', '第10名', '第9名', '第8名', '第7名', '第6名', '第5名', '第4名', '第3名', '第2名', '第1名']
                    }

                ],
                series: [
                    {
                        name: '排行榜',
                        type: 'bar',
                        label: {
                            normal: {
                                show: true,
                                position: 'right'
                            }
                        },
                        data: [11, 23, 32, 43, 54, 66, 111, 123, 132, 143, 154, 166]
                    }
                ]
            };

            // 使用刚指定的配置项和数据显示图表。
            myChart3.setOption(option3);
雷达图
var myChart1 = echarts.init(document.getElementById('radarOne'));

                       // 指定图表的配置项和数据
                       var option1 = {
                           title: {
                               text: '基础雷达图'
                           },
                           tooltip: {},
                           legend: {
                               data: ['预算分配']
                           },
                           radar: {

                               name: {
                                   textStyle: {
                                       color: '#fff',
                                       backgroundColor: '#999',
                                       borderRadius: 3,
                                       padding: [3, 5]
                                   }
                               },
                               indicator: [
                                   { name: '销售', max: 6500},
                                   { name: '管理', max: 16000},
                                   { name: '信息', max: 30000},
                                   { name: '客服', max: 38000},
                                   { name: '研发', max: 52000},
                                   { name: '研发', max: 52000},
                                   { name: '研发', max: 52000},
                                   { name: '研发', max: 52000},
                                   { name: '市场', max: 25000}
                               ],
                               center: ['50%', '50%'],
                               //雷达图的大小
                               radius: 100
                           },
                           series: [{
                               name: '预算 vs 开销',
                               type: 'radar',
                               data: [
                                   {
                                       value: [4300, 10000, 28000, 35000,  35000, 35000,  35000, 30000, 19000],
                                       name: '预算分配)',
                                       label: {
                                           show: true,
                                           formatter: function(params) {
                                               return params.value;
                                           }
                                       }
                                   }
                               ]
                           }]

                       };

                       // 使用刚指定的配置项和数据显示图表。
                       myChart1.setOption(option1);
之前只引入一个js,发现雷达图显示不出来,然后再去官网下载这两个js,后面才成功显示
<%-- 使用雷达图,要引入的js --%>
饼图
 var myChart2 = echarts.init(document.getElementById('circlePicture'));
            var option2 = {


                title: {
                    text: '部门前五采购占比',
                    left: 'center'
                },

                legend: {
                    orient: 'vertical',
                    left: 10,
                    data: ['人事部', '综合部', '三部', '二部', '四部']
                },

                series: [
                    {
                        name: '访问来源',
                        type: 'pie',
                        //调整大小
                        radius: ['20%', '25%'],
                        avoidLabelOverlap: false,
                        label: {
                            show: false,
                            position: 'center'
                        },
                        emphasis: {
                            label: {
                                show: true,
                                fontSize: '30',
                                fontWeight: 'bold'
                            }
                        },
                        labelLine: {
                            show: false
                        },
                        data: [
                            {value: 1, name: '人事部'},
                            {value: 2, name: '综合部'},
                            {value: 3, name: '三部'},
                            {value: 4, name: '二部'},
                            {value: 5, name: '四部'}
                        ],

                        //显示数据
                        itemStyle:{
                            normal:{
                                label:{
                                    show: true,
                                    formatter: '{b} : {c} ({d}%)'
                                },
                                labelLine :{show:true}
                            }
                        }
                    }
                ]

            };

            myChart2.setOption(option2);
折线图
var myChart3 = echarts.init(document.getElementById('linePicture01'));
            var option3 = {
                title:{
                    text:'采购总额走势',
                    left: 'center'
                },
                grid: {
                    left: '3%',
                    right: '4%',
                    //降低y轴的高度
                    top: '30%',
                    bottom: '3%',
                    containLabel: true
                },

                xAxis: {
                    type: 'category',
                    data: ['2021年1月', '2021年2月', '2021年3月',
                        '2021年4月', '2021年5月', '2021年6月', '2021年7月']
                },
                yAxis: {
                    type: 'value',
                    name: '进货/万元',
                    min: 0,
                    max: 30000,
                    interval: 10000,


                },
                series: [{
                    data: [8210, 9322, 9301, 9334, 21290, 21330, 13320],
                    type: 'line'
                }]

            };

            myChart3.setOption(option3);
柱状环比图
 //进货环比
            var myChart1 = echarts.init(document.getElementById('t1'));

            // 指定图表的配置项和数据
            var option1 = {

                title: {
                    text: '进货环比'
                },
                tooltip: {
                    trigger: 'axis',
                    axisPointer: {            // 坐标轴指示器,坐标轴触发有效
                        type: 'shadow'        // 默认为直线,可选为:'line' | 'shadow'
                    }
                },
                legend: {
                    data: []
                },
                grid: {
                    left: '3%',
                    right: '4%',
                    bottom: '3%',
                    containLabel: true
                },
                yAxis: [
                    {
                        type: 'value'
                    }
                ],
                xAxis: [
                    {
                        type: 'category',
                        axisTick: {
                            show: false
                        },
                        data: ['1月', '2月', '3月', '4月', '5月', '6月', '7月']
                    }
                ],
                series: [
                    {
                        name: '进货环比',
                        type: 'bar',
                        label: {
                            show: true,
                            position: 'inside'
                        },
                        data: [200, 170, -240, 244, 200, -220, 210]
                    }
                ]
            };

            // 使用刚指定的配置项和数据显示图表。
            myChart1.setOption(option1);
柱状加折线图
var myChart4 = echarts.init(document.getElementById('t4'));

            // 指定图表的配置项和数据
            var option4 = {

                //tooltip  提示框组件
                tooltip: {
                    trigger: 'axis',
                    axisPointer: {
                        type: 'cross',
                        crossStyle: {
                            color: '#999'
                        }
                    }
                },
                //数据视图、切换为折线图、切换为柱状图、还原功能、保存图片功能
                /*                toolbox: {
                                    feature: {
                                        dataView: {show: true, readOnly: false},
                                        magicType: {show: true, type: [ 'bar']},
                                        restore: {show: true},
                                        saveAsImage: {show: true}
                                    }
                                },*/
                //legend 图例组件
                legend: {
                    data: ['求和项:进货', '求和项:销售']
                },
                //左右距离
                grid: {
                    left: '3%',
                    right: '4%',

                    containLabel: true
                },
                //x轴数据
                xAxis: [
                    {
                        type: 'category',
                        data: ['1月', '2月', '3月', '4月', '5月', '6月', '7月', '8月', '9月', '10月', '11月', '12月'],
                        //axisPointer  坐标轴指示器   是指示坐标轴当前刻度的工具
                        axisPointer: {
                            type: 'shadow'
                        }
                    }
                ],
                //y轴数据
                yAxis: [
                    {
                        type: 'value',
                        name: '进货/万元',
                        min: 0,
                        max: 300,
                        interval: 50,
                        axisLabel: {
                            formatter: '{value}'
                        }
                    }
                    ,
                    {
                        type: 'value',
                        name: '销售/万元',
                        min: 0,
                        max: 300,
                        interval: 50,
                        axisLabel: {
                            formatter: '{value}'
                        }
                    }
                ],
                //对应要显示的数据,一般把后端转成成json格式传过来   bar柱状图   line折线图
                series: [
                    {
                        name: '求和项:进货',
                        type: 'bar',
                        //每个柱状图顶部显示具体数据
                        label: {
                            normal: {
                                show: true,
                                position: 'top'
                            }
                        },
                        data: [12.0, 4.9, 7.0, 23.2, 25.6, 76.7, 135.6, 162.2, 32.6, 20.0, 6.4, 3.3]
                    }
                    ,
                    {
                        name: '求和项:销售',
                        type: 'line',
                        yAxisIndex: 1,
                        //每个节点显示具体数据
                        label: {
                            normal: {
                                show: true,
                                position: 'top'
                            }
                        },
                        data: [2.0, 12.2, 13.3, 4.5, 6.3, 110.2, 20.3, 23.4, 23.0, 116.5, 12.0, 6.2]
                    }
                ]
            };

            // 使用刚指定的配置项和数据显示图表。
            myChart4.setOption(option4);
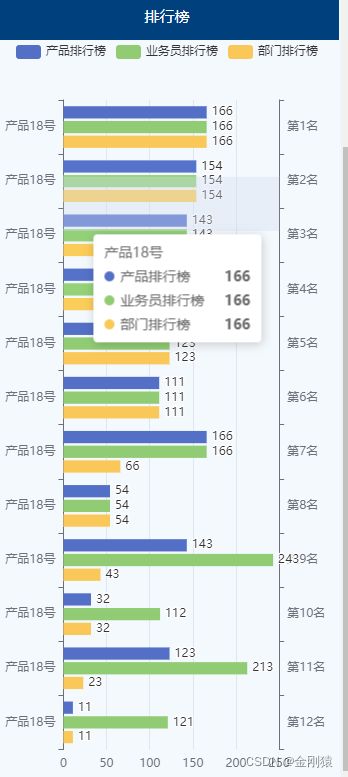
排行榜
var myChart5 = echarts.init(document.getElementById('t5'));

            // 指定图表的配置项和数据
            var option5 = {

/*            title: {
                text: '销售排行榜'

            },*/
            tooltip: {
                trigger: 'axis',
                    axisPointer: {
                    type: 'shadow'
                }
            },
            legend: {
                //data数据换行
                // orient: 'vertical',

                data: ['产品排行榜','业务员排行榜','部门排行榜']
            },
            grid: {
                left: '3%',
                    right: '4%',
                    bottom: '3%',
                    containLabel: true
            },
            xAxis: {
                type: 'value'
            },
            yAxis:[ {
                type: 'category',
                data: ['产品18号', '产品18号', '产品18号', '产品18号', '产品18号', '产品18号','产品18号', '产品18号', '产品18号', '产品18号', '产品18号', '产品18号']
            },
                {
                    type: 'category',
                    data: ['第12名','第11名','第10名','第9名','第8名','第7名','第6名', '第5名', '第4名', '第3名', '第2名', '第1名']}

            ],
                series: [
                {
                    name: '产品排行榜',
                    type: 'bar',
                    label: {
                        normal: {
                            show: true,
                            position: 'right'
                        }
                    },
                    data: [11, 123, 32, 143, 54, 166,111, 123, 132, 143, 154, 166]
                },
                    {
                        name: '业务员排行榜',
                        type: 'bar',
                        label: {
                            normal: {
                                show: true,
                                position: 'right'
                            }
                        },
                        data: [121, 213, 112, 243, 54, 166,111, 123, 132, 143, 154, 166]
                    },
                    {
                        name: '部门排行榜',
                        type: 'bar',
                        label: {
                            normal: {
                                show: true,
                                position: 'right'
                            }
                        },
                        data: [11, 23, 32, 43, 54, 66,111, 123, 132, 143, 154, 166]
                    }
            ]
            };

            // 使用刚指定的配置项和数据显示图表。
            myChart5.setOption(option5);
仅作个人记录
end


