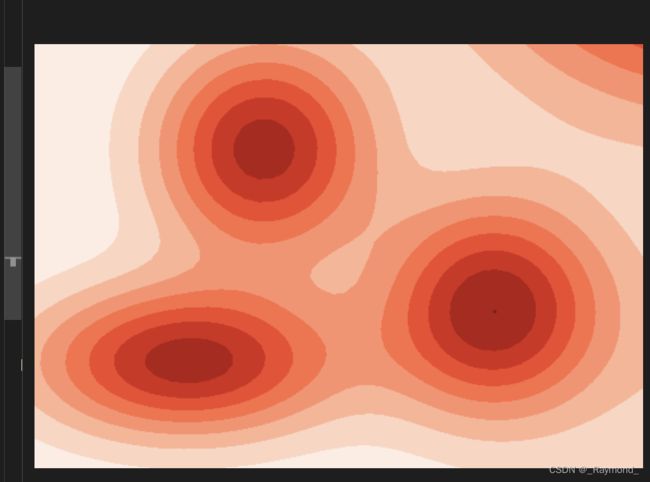
数据分布图-python 高斯分布三维等高线图像
创作不易,转载请注明出处
论文的画图的时候,发现别人的图很好看。大概长这样。折腾了半天发现可以用高斯分布模拟。

- 可以设置rv1,rv2,rv3来控制生成的峰的个数。
- 然后根据调整rv的mu和var来控制生成图像的形状。
- rvs=rv+rv1+rv2+rv3+…来合成波峰图
- np.clip来控制取值范围。
- 关闭x,y轴标签。
import matplotlib.pyplot as plt
from matplotlib import style
style.use('fivethirtyeight')
import numpy as np
from scipy.stats import multivariate_normal


#Parameters to set

shape=50 #采样间隔
x = np.linspace(-2,6,shape) #采样区间
y = np.linspace(-2,6,shape)
X,Y = np.meshgrid(x,y)

pos = np.array([X.flatten(),Y.flatten()]).T

# 波峰生成

rv = multivariate_normal([0, 0], [[2, 0], [0, 1]])

rv1 = multivariate_normal([1, 4], [[1, 0], [0, 2]])

rv2 = multivariate_normal([4, 1], [[1, 0], [0, 2]])

#图片外的波峰,可以填充边角的空白

rv3 = multivariate_normal([7, 8], [[5, 0], [0, 5]])


rv4 = multivariate_normal([8, 0], [[5, 0], [0, 5]])

# 波峰合成

rvs=rv.pdf(pos).reshape(shape,shape)+rv1.pdf(pos).reshape(shape,shape)+rv2.pdf(pos).reshape(shape,shape)+rv3.pdf(pos).reshape(shape,shape)*4+rv4.pdf(pos).reshape(shape,shape)*1

rvs=np.clip(rvs,0.01,0.16)
plt.contourf(X, Y,rvs ,8,cmap='Reds')
# plt.contourf(X, Y, ,cmap='Reds')

plt.xticks([])
plt.yticks([])
plt.axis('off')

# plt.colorbar()

plt.savefig("test2.png",bbox_inches='tight',pad_inches=0.0)


联系方式:[email protected]