Go语言性能优化建议与pprof性能调优详解——结合博客项目实战
文章目录
- 性能优化建议
-
- Benchmark的使用
- slice优化
-
- 预分配内存
- 大内存未释放
- map优化
- 字符串处理优化
- 结构体优化
- atomic包
- 小结
- pprof性能调优
-
- 采集性能数据
- 服务型应用
- go tool pprof命令
- 项目调优分析
-
- 修改`main.go`
- 安装go-wrk
- 命令行交互界面
- 图形化
- 火焰图
性能优化建议
简介:
- 性能优化的前提是满足正确可靠、简洁清晰等质量因素
- 性能优化是综合评估,有时候时间效率和空间效率可能对立
- 针对Go语言特性,介绍Go相关的性能优化建议
Benchmark的使用
性能表现需要实际数据衡量,Go语言提供了支持基准性能测试的benchmark工具。
示例:
//fib.go
package main

func Fib(n int) int {
    if n < 2 {
       return n
    }
    return Fib(n-1) + Fib(n-2)
}
//fib_test.go
package main

import (
    "testing"
)

func BenchmarkFib10(b *testing.B) {
    for i := 0; i < b.N; i++ {
       Fib(10)
    }
}
- benchmark 和普通的单元测试用例一样,都位于
_test.go文件中。 - 函数名以
Benchmark开头,参数是b *testing.B。和普通的单元测试用例很像,单元测试函数名以Test开头,参数是t *testing.T。
运行示例:
- 运行当前 package 内的用例:
go test . - 运行子 package 内的用例:
go test ./ - 如果想递归测试当前目录下的所有的 package:
go test ./...
go test 命令默认不运行 benchmark 用例的,如果我们想运行 benchmark 用例,需要加上 -bench 参数。例如:
$ go test -bench .
goos: windows
goarch: amd64
pkg: GoProject1
cpu: 11th Gen Intel(R) Core(TM) i7-11800H @ 2.30GHz
BenchmarkFib10-16        5496252               212.5 ns/op
PASS
ok      GoProject1      1.454s
goos: windows:这行显示运行基准测试的操作系统,此处为 Windows。goarch: amd64:这行显示运行基准测试的机器架构,此处为 64 位 AMD 架构。pkg: GoProject1:这行显示包含基准测试代码的包名,此处为 “GoProject1”。cpu: 11th Gen Intel(R) Core(TM) i7-11800H @ 2.30GHz:这行显示运行基准测试的机器 CPU 信息,包括 CPU 型号和时钟频率。PASS:这行表示所有的测试,包括基准测试,都已成功通过。ok GoProject1 1.454s:这行显示所有测试,包括基准测试,的整体执行时间。在这种情况下,整个测试套件执行时间大约为 1.454 秒。
BenchmarkFib10-16 是测试函数名,-16表示GOMAXPROCS的值为16,GOMAXPROCS 1.5版本后,默认值为CPU核数 。5496252 表示一共执行5496252 次,即b.N的值。212.5 ns/op表示每次执行花费212.5ns。
slice优化
预分配内存
接下来看两个函数:
func NoPreAlloc(size int) {
	data := make([]int, 0)
	for k := 0; k < size; k++ {
		data = append(data, k)
	}
}

func PreAlloc(size int) {
	data := make([]int, 0, size)
	for k := 0; k < size; k++ {
		data = append(data, k)
	}
}
分别为它们编写基准测试:
func BenchmarkNoPreAlloc(b *testing.B) {
	for i := 0; i < b.N; i++ {
		NoPreAlloc(1000000)

	}
}

func BenchmarkPreAlloc(b *testing.B) {
	for i := 0; i < b.N; i++ {
		PreAlloc(1000000)

	}
}
运行结果如下:
$ go test -bench .
goos: windows
goarch: amd64
pkg: GoProject1
cpu: 11th Gen Intel(R) Core(TM) i7-11800H @ 2.30GHz
BenchmarkNoPreAlloc-16               193           5968006 ns/op
BenchmarkPreAlloc-16                1498            825965 ns/op
PASS
ok      GoProject1      3.164s
可以看到预分配内存后,性能更好。因此应尽可能在使用make()初始化切片时提供容量信息。
大内存未释放
当我们在已有切片基础上创建新的切片时,新切片并不会创建一个新的底层数组。相反,它会共享同一个底层数组。这种情况下,如果我们从一个大切片中截取出一个小切片,并且在代码中保留对大切片的引用,那么原底层数组将会一直存在于内存中,得不到释放,即使大切片的内容对我们来说已经不再需要了。
举例说明: 假设有一个名为bigSlice的大切片,其底层数组非常大。然后我们基于bigSlice创建一个新的小切片smallSlice,并且在代码中保留对bigSlice的引用。这样一来,即使我们只使用smallSlice,底层数组也不会被释放,导致占用大量的内存。
优化建议:使用copy替代re-slice 为了避免上述陷阱,我们可以使用copy操作来创建一个新的切片,而不是在已有切片基础上使用re-slice。copy操作会将源切片的内容复制到一个新的底层数组中,这样就不会和原始切片共享底层数组,避免了底层数组无法释放的问题。
示例代码:
goCopy codebigSlice := make([]int, 1000000) // 假设bigSlice是一个非常大的切片
// 使用re-slice,smallSlice和bigSlice共享同一个底层数组
smallSlice := bigSlice[:100]

// 使用copy,创建一个新的切片,底层数组得到释放
smallSlice = make([]int, 100)
copy(smallSlice, bigSlice[:100])
通过使用copy操作,我们可以避免因为底层数组无法释放而导致的内存浪费问题。
map优化
示例代码:
func NoPreAlloc(size int) {
    data := make(map[int]int)
    for k := 0; k < size; k++ {
       data[k] = 1
    }
}

func PreAlloc(size int) {
    data := make(map[int]int, size)
    for k := 0; k < size; k++ {
       data[k] = 1
    }
}
func BenchmarkNoPreAlloc(b *testing.B) {
	for n := 0; n < b.N; n++ {
		NoPreAlloc(1000000)
	}
}

func BenchmarkPreAlloc(b *testing.B) {
	for n := 0; n < b.N; n++ {
		PreAlloc(1000000)
	}
}
运行测试:
$ go test -bench .
goos: windows
goarch: amd64
pkg: GoProject1
cpu: 11th Gen Intel(R) Core(TM) i7-11800H @ 2.30GHz
BenchmarkNoPreAlloc-16                12          90044942 ns/op
BenchmarkPreAlloc-16                  26          50461700 ns/op
PASS
ok      GoProject1      2.637s
可以发现map预分配内存后效果更好。
分析:
- 不断向map中添加元素的操作会触发map的扩容
- 提前分配好空间可以减少内存拷贝和Rehash的消耗。
- 建议根据实际需求提前预估好需要的空间
字符串处理优化
使用strings.Builder、预分配内存。
示例代码:
func Plus(n int, str string) string {
    s := ""
    for i := 0; i < n; i++ {
       s += str
    }
    return s
}

func StrBuilder(n int, str string) string {
    var builder strings.Builder
    for i := 0; i < n; i++ {
       builder.WriteString(str)
    }
    return builder.String()
}

func ByteBuffer(n int, str string) string {
    buf := new(bytes.Buffer)
    for i := 0; i < n; i++ {
       buf.WriteString(str)
    }
    return buf.String()
}

func PreStrBuilder(n int, str string) string {
	var builder strings.Builder
	builder.Grow(n * len(str))
	for i := 0; i < n; i++ {
		builder.WriteString(str)
	}
	return builder.String()
}
func PreStrByteBuffer(n int, str string) string {
	buf := new(bytes.Buffer)
	buf.Grow(n * len(str))
	for i := 0; i < n; i++ {
		buf.WriteString(str)
	}
	return buf.String()
}
func BenchmarkPlus(b *testing.B) {
	for i := 0; i < b.N; i++ {
		Plus(100000, "wxy")
	}
}

func BenchmarkStrBuilder(b *testing.B) {
	for i := 0; i < b.N; i++ {
		StrBuilder(100000, "wxy")
	}
}

func BenchmarkByteBuffer(b *testing.B) {
	for i := 0; i < b.N; i++ {
		ByteBuffer(100000, "wxy")
	}
}

func BenchmarkPreStrBuilder(b *testing.B) {
	for i := 0; i < b.N; i++ {
		PreStrBuilder(100000, "wxy")
	}
}

func BenchmarkPreByteBuffer(b *testing.B) {
	for i := 0; i < b.N; i++ {
		PreStrByteBuffer(100000, "wxy")
	}
}
运行结果:
$ go test -bench .
goos: windows
goarch: amd64
pkg: GoProject1
cpu: 11th Gen Intel(R) Core(TM) i7-11800H @ 2.30GHz
BenchmarkPlus-16                       1        1126084200 ns/op
BenchmarkStrBuilder-16              3982            284773 ns/op
BenchmarkByteBuffer-16              2947            485091 ns/op
BenchmarkPreStrBuilder-16           4771            278961 ns/op
BenchmarkPreByteBuffer-16           3310            364676 ns/op
PASS
ok      GoProject1      6.457s
- 使用
+拼接性能最差,strings.Builder,bytes.Buffer相近,strings.Builder更快 - 字符串在Go语言中是不可变类型,占用内存大小是固定的
- 使用
+每次都会重新分配内存 strings.Builder,bytes.Buffer底层都是[]byte数组。内存扩容策略,不需要每次拼接重新分配内存- 预分配内存后,
strings.Builder,bytes.Buffer性能都有所提升
结构体优化
示例代码:
func EmptyStructMap(n int) {
    m := make(map[int]struct{})
    for i := 0; i < n; i++ {
       m[i] = struct{}{}
    }
}
func BoolMap(n int) {
    m := make(map[int]bool)
    for i := 0; i < n; i++ {
       m[i] = false
    }
}
func BenchmarkEmptyStructMap(b *testing.B) {
    for i := 0; i < b.N; i++ {
       EmptyStructMap(100000000)
    }
}

func BenchmarkBoolMap(b *testing.B) {
    for i := 0; i < b.N; i++ {
       BoolMap(100000000)
    }
}
执行结果:
$ go test -bench .
goos: windows
goarch: amd64
pkg: GoProject1
cpu: 11th Gen Intel(R) Core(TM) i7-11800H @ 2.30GHz
BenchmarkEmptyStructMap-16             1        13943515100 ns/op
BenchmarkBoolMap-16                    1        14002905100 ns/op
PASS
ok      GoProject1      28.215s
可以发现使用空结构体性能较好。
使用空结构体节省内存:
- 空结构体struct{}实例不占据任何的内存空间
- 可作为各种场景下的占位符使用
- 节省资源
- 空结构体本身具备很强的语义,即这里不需要任何值,仅作为占位符
atomic包
示例代码:
type atomicCounter struct {
    i int32
}

func AtomicAddOne(c *atomicCounter) {
    atomic.AddInt32(&c.i, 1)
}

type mutexCounter struct {
    i int32
    m sync.Mutex
}

func MutexAddOne(c *mutexCounter) {
    c.m.Lock()
    c.i++
    c.m.Unlock()
}
func BenchmarkAtomicAddOne(b *testing.B) {
    var c atomicCounter
    b.ResetTimer()
    for i := 0; i < b.N; i++ {
       AtomicAddOne(&c)
    }
}

func BenchmarkMutexAddOne(b *testing.B) {
    var c mutexCounter
    b.ResetTimer()
    for i := 0; i < b.N; i++ {
       MutexAddOne(&c)
    }
}
运行结果:
$ go test -bench .
goos: windows
goarch: amd64
pkg: GoProject1
cpu: 11th Gen Intel(R) Core(TM) i7-11800H @ 2.30GHz
BenchmarkAtomicAddOne-16        255736488                4.565 ns/op
BenchmarkMutexAddOne-16         99685160                13.66 ns/op
PASS
ok      GoProject1      3.101s
使用atomic包:
- 锁的实现是通过操作系统来实现,属于系统调用
- atomic操作是通过硬件实现,效率比锁高
- sync.Mutex应该用来保护一段逻辑,不仅仅用于保护一个变量
- 对于非数值操作,可以使用atomic.Value,能承载一个interface{}
小结
- 避免常见的性能陷阱可以保证大部分程序的性能
- 普通应用代码,不要一味地追求程序的性能
- 越高级的性能优化手段越容易出现问题
- 在满足正确可靠、简洁清晰的质量要求的前提下提高程序性能
pprof性能调优
在计算机性能调试领域里,profiling 是指对应用程序的画像,画像就是应用程序使用 CPU 和内存的情况。 Go语言是一个对性能特别看重的语言,因此语言中自带了 profiling 的库。
Go语言项目中的性能优化主要有以下几个方面:
- CPU profile:报告程序的 CPU 使用情况,按照一定频率去采集应用程序在 CPU 和寄存器上面的数据
- Memory Profile(Heap Profile):报告程序的内存使用情况
- Block Profiling:报告 goroutines 不在运行状态的情况,可以用来分析和查找死锁等性能瓶颈
- Goroutine Profiling:报告 goroutines 的使用情况,有哪些 goroutine,它们的调用关系是怎样的
采集性能数据
Go语言内置了获取程序的运行数据的工具,包括以下两个标准库:
runtime/pprof:采集工具型应用运行数据进行分析net/http/pprof:采集服务型应用运行时数据进行分析
pprof开启后,每隔一段时间(10ms)就会收集下当前的堆栈信息,获取各个函数占用的CPU以及内存资源;最后通过对这些采样数据进行分析,形成一个性能分析报告。
注意,我们只应该在性能测试的时候才在代码中引入pprof。
本篇文章只对服务型应用进行性能分析。
服务型应用
如果你的应用程序是一直运行的,比如 web 应用,那么可以使用net/http/pprof库,它能够在提供 HTTP 服务进行分析。
如果使用了默认的http.DefaultServeMux(通常是代码直接使用 http.ListenAndServe(“0.0.0.0:8000”, nil)),只需要在你的web server端代码中按如下方式导入net/http/pprof
import _ "net/http/pprof"
如果你使用自定义的 Mux,则需要手动注册一些路由规则:
r.HandleFunc("/debug/pprof/", pprof.Index)
r.HandleFunc("/debug/pprof/cmdline", pprof.Cmdline)
r.HandleFunc("/debug/pprof/profile", pprof.Profile)
r.HandleFunc("/debug/pprof/symbol", pprof.Symbol)
r.HandleFunc("/debug/pprof/trace", pprof.Trace)
如果你使用的是gin框架,那么推荐使用github.com/gin-contrib/pprof,在代码中通过以下命令注册pprof相关路由。
pprof.Register(router)
不管哪种方式,你的 HTTP 服务都会多出http://host:port/debug/pprof ,访问它会得到类似下面的内容:
这个路径下还有几个子页面:
- /debug/pprof/profile:访问这个链接会自动进行 CPU profiling,持续 30s,并生成一个文件供下载
- /debug/pprof/heap: Memory Profiling 的路径,访问这个链接会得到一个内存 Profiling 结果的文件
- /debug/pprof/block:block Profiling 的路径
- /debug/pprof/goroutines:运行的 goroutines 列表,以及调用关系
下面是详细的解释:
Allocs: 过去所有内存分配的抽样
Block: 导致同步原语阻塞的堆栈跟踪
Cmdline: 当前程序的命令行调用
Goroutine: 所有当前 goroutine 的堆栈跟踪。使用 debug = 2作为查询参数,以与未恢复的惊慌相同的格式导出。
Heap: 活动对象的内存分配的抽样。在获取堆示例之前,可以指定 gc GET 参数来运行 GC。
Mutex: 对争用的互斥对象的持有者进行跟踪堆栈
profile: CPU 配置文件。可以在秒 GET 参数中指定持续时间。获得概要文件之后,使用 go 工具 pprof 命令调查概要文件。
Threadcreate: 导致创建新操作系统线程的堆栈跟踪
Trace: 当前程序执行的跟踪。可以在秒 GET 参数中指定持续时间。获得跟踪文件后,使用 go tool trace 命令调查跟踪。
go tool pprof命令
不管是工具型应用还是服务型应用,我们使用相应的pprof库获取数据之后,下一步的都要对这些数据进行分析,我们可以使用go tool pprof命令行工具。
go tool pprof最简单的使用方式为:
go tool pprof [binary] [source]
其中:
- binary 是应用的二进制文件,用来解析各种符号;
- source 表示 profile 数据的来源,可以是本地的文件,也可以是 http 地址。
注意事项: 获取的 Profiling 数据是动态的,要想获得有效的数据,请保证应用处于较大的负载(比如正在生成中运行的服务,或者通过其他工具模拟访问压力)。否则如果应用处于空闲状态,得到的结果可能没有任何意义。
项目调优分析
本案例使用了blob项目——类似博客的管理系统,用beego实现,源码我已经放到了github仓库里:https://github.com/uestc-wxy/blob,里面也有详细的使用说明。
CSDN资源:https://download.csdn.net/download/m0_63230155/88131546?spm=1001.2014.3001.5503
修改main.go
为了能对这个项目进行调优分析,需要在main.go文件里添加几行代码:
import (
    "net/http"
    _ "net/http/pprof"
)
go func() {
       http.ListenAndServe("localhost:8080", nil)
    }()
下面是修改后的main.go(只需要修改这一个文件):
package main

import (
    _ "blob/models"
    _ "blob/routers"
    "blob/utils"
    "fmt"
    "github.com/beego/beego/v2/client/orm"
    "github.com/beego/beego/v2/server/web"
    _ "github.com/go-sql-driver/mysql"
    "net/http"
    _ "net/http/pprof"
)

func init() {
    username, _ := web.AppConfig.String("username")
    password, _ := web.AppConfig.String("password")
    host, _ := web.AppConfig.String("host")
    port, _ := web.AppConfig.String("port")
    database, _ := web.AppConfig.String("database")

    datasource := fmt.Sprintf("%s:%s@tcp(%s:%s)/%s?charset=utf8mb4&loc=Local", username, password, host, port, database)
    err := orm.RegisterDataBase("default", "mysql", datasource)
    if err != nil {
       fmt.Printf("%v\n", err)
    }

    err = orm.RunSyncdb("default", false, true)
    if err != nil {
       fmt.Printf("%v\n", err)
    }

}

func main() {
    web.InsertFilter("/cms/index/*", web.BeforeRouter, utils.CmsLoginFilter)
    orm.RunCommand()
    go func() {
       http.ListenAndServe("localhost:8080", nil)
    }()
    web.Run()
}
安装go-wrk
为了使数据直观便于分析,需要使用压测工具。
推荐使用:https://github.com/wg/wrk 或 https://github.com/adjust/go-wrk,由于我是Windows系统,于是选择了后者,因为前者对Windows并不是很友好,虽然它的star数还要多些。
在GOPATH/src路径终端依次运行下列命令,注意是GOPATH/src:
git clone https://github.com/adjust/go-wrk.git
cd go-wrk
go mod init
go mod tidy
go build
这时你会发现go-wrk项目里会多出go-wrk.exe文件,为了方便使用我选择把它放在(也就是复制粘贴过去)GOPATH/bin目录下,当然你得把GOPATH/bin放在环境变量里面,至于为什么将go-wrk.exe放在$GOPATH/bin 里面,这似乎是一种规范。我的其他文章也有提到过。
通过上述操作就可以在任何地方使用go-wrk命令了。
命令行交互界面
首先需要保证我们的项目需要在本地跑起来。在项目根目录终端运行:
go build
./blob
当然也可以使用bee run命令,毕竟这是beego项目特有的运行方式。
然后在该路径下再开一个终端,用来跑压测,执行命令:
go-wrk -n 50000 http://localhost:8080/
执行上面的代码会进入交互界面如下:
(base) PS F:\GolandProjects\beegoProject\blob> go-wrk -n 50000 http://localhost:8080/
==========================BENCHMARK==========================
URL:                            http://localhost:8080/

Used Connections:               100
Used Threads:                   1
Total number of calls:          50000

===========================TIMINGS===========================
Total time passed:              22.95s
Avg time per request:           45.76ms
Requests per second:            2179.05
Median time per request:        45.14ms
99th percentile time:           53.77ms
Slowest time for request:       119.00ms

=============================DATA=============================
Total response body sizes:              251100000
Avg response body per request:          5022.00 Byte
Transfer rate per second:               10943208.24 Byte/s (10.94 MByte/s)
==========================RESPONSES==========================
20X Responses:          50000   (100.00%)
30X Responses:          0       (0.00%)
40X Responses:          0       (0.00%)
50X Responses:          0       (0.00%)
Errors:                 0       (0.00%)
接着再开一个终端,以使用pprof来分析。
执行命令:
go tool pprof http://127.0.0.1:8080/debug/pprof/profile
执行上面的代码会进入交互界面如下:
(base) PS F:\GolandProjects\beegoProject\blob> go tool pprof http://127.0.0.1:8080/debug/pprof/profile
Fetching profile over HTTP from http://127.0.0.1:8080/debug/pprof/profile
Saved profile in C:\Users\19393\pprof\pprof.blob.exe.samples.cpu.004.pb.gz
File: blob.exe
Build ID: F:\GolandProjects\beegoProject\blob\blob.exe2023-08-01 16:06:16.7719208 +0800 CST
Type: cpu
Time: Aug 1, 2023 at 4:10pm (CST)
Duration: 30s, Total samples = 44.41s (148.02%)
Entering interactive mode (type "help" for commands, "o" for options)
(pprof)
我们可以在交互界面输入top5来查看程序中占用CPU前5位的函数:
(pprof) top5
Showing nodes accounting for 27510ms, 61.95% of 44410ms total
Dropped 859 nodes (cum <= 222.05ms)
Showing top 5 nodes out of 246
      flat  flat%   sum%        cum   cum%
   21960ms 49.45% 49.45%    22080ms 49.72%  runtime.cgocall
    2010ms  4.53% 53.97%     5980ms 13.47%  runtime.scanobject
    1410ms  3.17% 57.15%     1740ms  3.92%  runtime.greyobject
    1340ms  3.02% 60.17%     1730ms  3.90%  runtime.findObject
     790ms  1.78% 61.95%      790ms  1.78%  runtime.stdcall2
其中:
- flat:当前函数占用CPU的耗时
- flat::当前函数占用CPU的耗时百分比
- sun%:函数占用CPU的耗时累计百分比
- cum:当前函数加上调用当前函数的函数占用CPU的总耗时
- cum%:当前函数加上调用当前函数的函数占用CPU的总耗时百分比
- 最后一列:函数名称
我们发现上面并没有我们自己写的函数,所以本项目的性能还是不错的。在大多数的情况下,我们可以通过分析这五列得出一个应用程序的运行情况,并对程序进行优化。
我们还可以使用list 函数名命令查看具体的函数分析,例如执行list cgocall查看我们编写的函数的详细分析。
(pprof) list cgocall
Total: 44.41s
ROUTINE ======================== runtime.cgocall in F:\Users\19393\sdk\go1.20.4\src\runtime\cgocall.go
    21.96s     22.08s (flat, cum) 49.72% of Total
         .          .    123:func cgocall(fn, arg unsafe.Pointer) int32 {
         .          .    124:   if !iscgo && GOOS != "solaris" && GOOS != "illumos" && GOOS != "windows" {
         .          .    125:           throw("cgocall unavailable")
         .          .    126:   }
         .          .    127:
         .          .    128:   if fn == nil {
         .          .    129:           throw("cgocall nil")
         .          .    130:   }
         .          .    131:
         .          .    132:   if raceenabled {
         .          .    133:           racereleasemerge(unsafe.Pointer(&racecgosync))
         .          .    134:   }
         .          .    135:
         .          .    136:   mp := getg().m
         .          .    137:   mp.ncgocall++
         .          .    138:   mp.ncgo++
         .          .    139:
         .          .    140:   // Reset traceback.
         .          .    141:   mp.cgoCallers[0] = 0
         .          .    142:
         .          .    143:   // Announce we are entering a system call
         .          .    144:   // so that the scheduler knows to create another
         .          .    145:   // M to run goroutines while we are in the
         .          .    146:   // foreign code.
         .          .    147:   //
         .          .    148:   // The call to asmcgocall is guaranteed not to
         .          .    149:   // grow the stack and does not allocate memory,
         .          .    150:   // so it is safe to call while "in a system call", outside
         .          .    151:   // the $GOMAXPROCS accounting.
         .          .    152:   //
         .          .    153:   // fn may call back into Go code, in which case we'll exit the
         .          .    154:   // "system call", run the Go code (which may grow the stack),
         .          .    155:   // and then re-enter the "system call" reusing the PC and SP
         .          .    156:   // saved by entersyscall here.
    21.94s     21.94s    157:   entersyscall()
         .          .    158:
         .          .    159:   // Tell asynchronous preemption that we're entering external
         .          .    168:
         .          .    169:   // Update accounting before exitsyscall because exitsyscall may
         .          .    170:   // reschedule us on to a different M.
         .          .    171:   mp.incgo = false
         .          .    172:   mp.ncgo--
         .          .    173:
      20ms       40ms    174:   osPreemptExtExit(mp)
         .          .    175:
         .      100ms    176:   exitsyscall()
         .          .    177:
         .          .    178:   // Note that raceacquire must be called only after exitsyscall has
         .          .    179:   // wired this M to a P.
         .          .    180:   if raceenabled {
         .          .    181:           raceacquire(unsafe.Pointer(&racecgosync))
通过分析发现大部分CPU资源被157行占用,耗时21.94s。
图形化
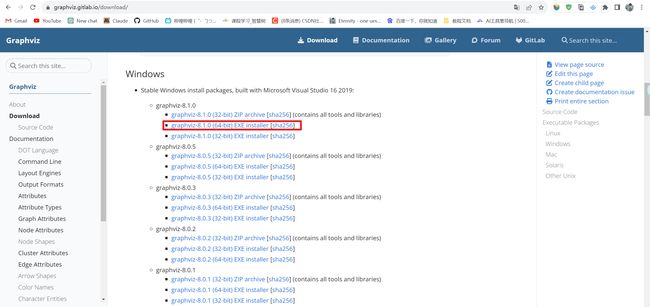
或者可以直接输入web,通过svg图的方式查看程序中详细的CPU占用情况。 想要查看图形化的界面首先需要安装graphviz图形化工具。由于我是Windows系统,进入官网下载graphviz:https://graphviz.gitlab.io/download/
下载完后打开exe文件进行安装。
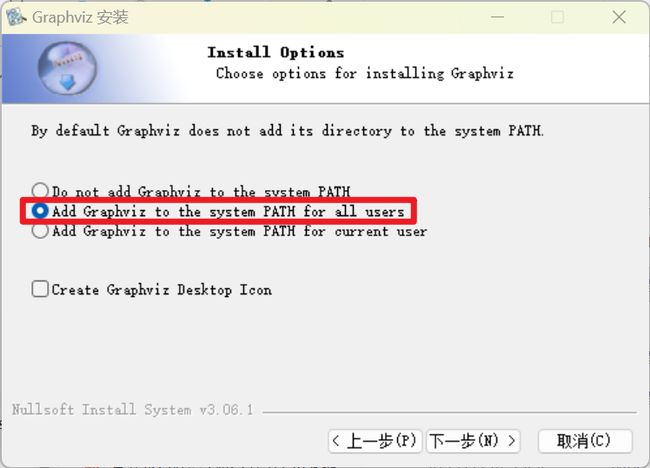
这里勾选第二个,自动帮你配置环境变量。后面快捷方式我选择不创建。
安装完毕后打开终端运行dot -v检查是否安装成功,安装成功应该会显示以下内容:
(base) PS C:\Users\19393> dot -v
dot - graphviz version 8.1.0 (20230707.0739)
libdir = "F:\Program Files\Graphviz\bin"
Activated plugin library: gvplugin_dot_layout.dll
Using layout: dot:dot_layout
Activated plugin library: gvplugin_core.dll
Using render: dot:core
Using device: dot:dot:core
The plugin configuration file:
        F:\Program Files\Graphviz\bin\config6
                was successfully loaded.
    render      :  cairo dot dot_json fig gdiplus json json0 map mp pic pov ps svg tk xdot xdot_json
    layout      :  circo dot fdp neato nop nop1 nop2 osage patchwork sfdp twopi
    textlayout  :  textlayout
    device      :  bmp canon cmap cmapx cmapx_np dot dot_json emf emfplus eps fig gif gv imap imap_np ismap jpe jpeg jpg json json0 metafile mp pdf pic plain plain-ext png pov ps ps2 svg tif tiff tk xdot xdot1.2 xdot1.4 xdot_json
    loadimage   :  (lib) bmp eps gif jpe jpeg jpg png ps svg
输入web前确认graphviz安装目录下的bin文件夹有无被添加到Path环境变量(我添加的系统变量)中。
接下来我们尝试用图形化的界面来进行分析。
先保证自己的beego项目运行在本地上,再开一个终端跑压测:go-wrk -n 50000 http://localhost:8080/,另外再来一个和终端跑pprof,执行命令:go tool pprof http://127.0.0.1:8080/debug/pprof/profile。
跑pprof的终端如下:
(base) PS F:\GolandProjects\beegoProject\blob> go tool pprof http://127.0.0.1:8080/debug/pprof/profile
Fetching profile over HTTP from http://127.0.0.1:8080/debug/pprof/profile
Saved profile in C:\Users\19393\pprof\pprof.blob.exe.samples.cpu.008.pb.gz
File: blob.exe
Build ID: F:\GolandProjects\beegoProject\blob\blob.exe2023-08-01 16:06:16.7719208 +0800 CST
Type: cpu
Time: Aug 1, 2023 at 7:02pm (CST)
Duration: 30s, Total samples = 44.25s (147.48%)
Entering interactive mode (type "help" for commands, "o" for options)
(pprof) web
(pprof)
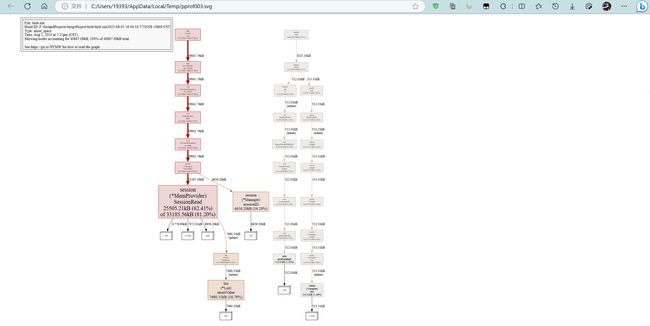
由于输入了web命令,浏览器会自动弹出查看svg的页面:
关于图形的说明: 每个框代表一个函数,理论上框的越大表示占用的CPU资源越多。 方框之间的线条代表函数之间的调用关系。 线条上的数字表示函数调用的时间。 方框中的第一行数字表示当前函数占用CPU的百分比,第二行数字表示当前函数累计占用CPU的百分比。
除了分析CPU性能数据,pprof也支持分析内存性能数据。比如,使用下面的命令分析http服务的heap性能数据,查看当前程序的内存占用以及热点内存对象使用的情况。
# 查看内存占用数据
go tool pprof -inuse_space http://127.0.0.1:8080/debug/pprof/heap
go tool pprof -inuse_objects http://127.0.0.1:8080/debug/pprof/heap
# 查看临时内存分配数据
go tool pprof -alloc_space http://127.0.0.1:8080/debug/pprof/heap
go tool pprof -alloc_objects http://127.0.0.1:8080/debug/pprof/heap
以下是查看内存占用数据的示例:
火焰图
火焰图(Flame Graph)是 Bredan Gregg 创建的一种性能分析图表,因为它的样子近似 而得名。
可以通过如下方式来打开火焰图:
- 先把压测跑上:
go-wrk -n 50000 http://localhost:8080/ - 项目根目录新开一个终端,运行
go tool pprof -http=:5200 http://127.0.0.1:8080/debug/pprof/profile,30s后,浏览器会自动跳出新界面:http://localhost:5200/ui/,如下:
- 跟之前的图形化界面差不多,接下来点击下图中图示任一个便能看到火焰图。
老版火焰图:
新版火焰图:
火焰图的优点是它是动态的:可以通过点击每个方块来 分析它下面的内容。
火焰图的调用顺序从上到下,每个方块代表一个函数,它下面一层表示这个函数会调用哪些函数,方块的大小代表了占用 CPU 使用的长短。火焰图的配色并没有特殊的意义,默认的红、黄配色是为了更像火焰而已。
火焰图的y轴表示cpu调用方法的先后,x轴表示在每个采样调用时间内,方法所占的时间百分比,越宽代表占据cpu时间越多。通过火焰图我们就可以更清楚的找出耗时长的函数调用,然后不断的修正代码,重新采样,不断优化。
此外还可以借助火焰图分析内存性能数据:
go tool pprof -http=:5200 -inuse_space http://127.0.0.1:8080/debug/pprof/heap
go tool pprof -http=:5200 -inuse_objects http://127.0.0.1:8080/debug/pprof/heap
go tool pprof -http=:5200 -alloc_space http://127.0.0.1:8080/debug/pprof/heap
go tool pprof -http=:5200 -alloc_objects http://127.0.0.1:8080/debug/pprof/heap
内存性能火焰图示例:


