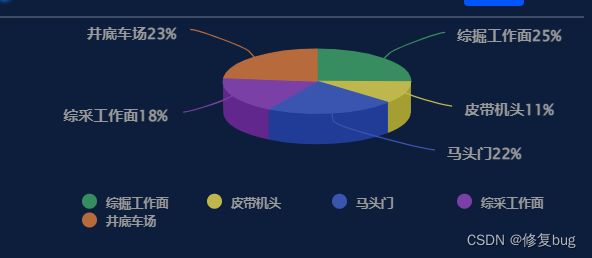
效果图

一、下载highcharts插件
npm install highcharts
二、main.js全局配置插件
import Highcharts from "highcharts/highcharts";
import highcharts3d from "highcharts/highcharts-3d";
highcharts3d(Highcharts);
三、封装highcharts.vue组件
Highcharts.chart("EchartsPie", {
        chart: {
          type: "pie", //饼图
          options3d: {
            enabled: true, //使用3d功能
            alpha: 70, //延y轴向内的倾斜角度
            beta: 0,
          },
          backgroundColor: "rgba(0, 0, 0, 0)", // 不显示背景色
          width: 520,
          height: 220, //设置大小是为了饼图能在想要的区域中显示
        },
        legend: {
          bottom: "0%",
          itemStyle: {
            //图例文字的样式
            color: "#999",
            fontSize: 10,
          },
          left: "center",
          itemWidth: 100,
          // doesn't perfectly work with our tricks, disable it
          selectedMode: false,
          data: this.dataList.map((item, index) => {
            item.icon = "circle";
            return item;
          }),
        },
        title: {
          text: "", //图表的标题文字
        },
        subtitle: {
          text: "", //副标题文字
        },
        plotOptions: {
          pie: {
            allowPointSelect: true, //每个扇块能否选中
            cursor: "pointer", //鼠标指针
            size: 150,
            showInLegend: true, // 是否显示图例
            depth: 35, //饼图的厚度
            dataLabels: {
              enabled: true, //是否显示饼图的线形tip
              distance: 30, //设置引导线的长度
              color: "#999", //全局设置字体颜色
              style: {
                textOutline: "none", //去掉文字白边
                fontSize: "12",
              },
              formatter: function () {
                return this.point.name + this.y + "%";
              },
            },
          },
        },
        credits: {
          enabled: false, //禁用版权url    此处不设置
        },
        series: [
          {
            type: "pie",
            name: "", //统一的前置词,非必须
            data: [
              { name: "测试1:", y: 6.3, color: "#388D60" },
              { name: "测试2:", y: 2.3, color: "#BEB84C" },
              { name: "测试3:", y: 2.3, color: "#3A55B0" },
              { name: "测试4:", y: 9.3, color: "#7B40A5" },
              { name: "测试5:", y: 0.0, color: "#B76B3D" },
            ],
            startAngle: 0, //调整饼图的角度   方向:顺时针
            label: {
              show: true,
              position: "outside",
              formatter: "{b}:{d}%",
              normal: {
                show: true,
                fontSize: 14,
                formatter: ["  {a|{b}:{d}%}"].join("\n"), //用\n来换行
                rich: {
                  a: {
                    left: 20,
                    padding: [0, -140, 0, -180], //位置按需要调整
                  },
                },
              },
            },
          },
        ],
      });
四、页面调用
import EchartsBtD from "./components/echarts.bt3d.vue";
export default {
  components: { EchartsBtD },
  name: "top",
  data() {
    return {
      dataList: [
        {
          name: "综掘工作面",
          y: 25,
        },
        {
          name: "皮带机头",
          y: 11,
        },
        {
          name: "马头门",
          y: 22,
        },
        {
          name: "综采工作面",
          y: 18,
        },
        {
          name: "井底车场",
          y: 23,
        },
      ],
    };
  },
},
五、组件完整代码
