echarts datazoom功能设置
dataZoom: [
{
type: 'slider',
handleSize: "0%",
moveHandleSize: 0,
height: 8,
backgroundColor: "#F2F3F8",
fillerColor: "#DCDFE6",
bottom: 0,
startValue: 0,
endValue: 5,
showDetail: false ,
zoomLock: true,// 锁定窗口的大小
filterMode:'empty',
maxValueSpan:6,
minValueSpan:6,
brushSelect:false,//是否开启刷选功能,开启之后可以进行拉选显示的范围
}
],
完整的代码:
props: {
color: {
type: Array,
default: () => ['#0092FF', '#929292', '#7269F2', '#E64545']
},
xAxisData: {
type: Array,
default: () => []
},
seriesData: {
type: Object,
default: () => {
return {
pslData: [],
psxsData: [],
tbData: [],
hbData: [],
}
}
},
},
initChart() {
const color = this.color;
const legendData = ['排水量', '排水系数', '同比', '环比'];
const pslData = this.seriesData.pslData;
const psxsData = this.seriesData.psxsData;
const tbData = this.seriesData.tbData;
const hbData = this.seriesData.hbData;
const xAxisData = this.xAxisData;
let chart = this.$echarts.init(this.$refs.lineBar);
let option = {
tooltip: {
trigger: 'axis',
axisPointer: {
type: 'cross',
crossStyle: {
color: '#999'
}
}
},
color: color,
dataZoom: [
{
type: 'slider',
handleSize: "0%",
moveHandleSize: 0,
height: 8,
backgroundColor: "#F2F3F8",
fillerColor: "#DCDFE6",
bottom: 0,
startValue: 0,
endValue: 5,
showDetail: false ,
zoomLock: true,
filterMode:'empty',
maxValueSpan:6,
minValueSpan:6,
brushSelect:false,
}
],
legend: {
data: legendData,
textStyle: {
color: '#90959E'
},
left: 0,
},
grid: {
bottom: 40,
},
xAxis: [
{
type: 'category',
data: xAxisData,
axisPointer: {
type: 'shadow'
},
axisTick: {
show: false
},
axisLine: {
lineStyle: {
color: '#DCDFE6'
}
},
axisLabel: {
color: "#90959E",
fontSize: 14,
interval: 0,
},
}
],
yAxis: [
{
type: 'value',
name: '单位:m³',
nameTextStyle: {
color: '#90959E',
// align: 'right'
},
alignTicks: true,
min: 0,
axisLabel: {
color: "#90959E",
fontSize: 14
},
splitLine: {
lineStyle: {
color: " #DCDFE6"
}
}
},
{
type: 'value',
name: '单位:%',
nameTextStyle: {
color: '#90959E',
// align: 'right'
},
alignTicks: true,
min: 0,
axisLabel: {
color: "#90959E",
fontSize: 14
},
splitLine: {
lineStyle: {
color: " #DCDFE6"
}
}
}
],
series: [
{
name: legendData[0],
type: 'bar',
barWidth: 12,
tooltip: {
valueFormatter: function (value) {
return value + ' ml';
}
},
data: pslData
},
{
name: legendData[1],
type: 'line',
yAxisIndex: 1,
tooltip: {
valueFormatter: function (value) {
return value + ' °C';
}
},
data: psxsData
},
{
name: legendData[1],
type: 'line',
yAxisIndex: 1,
tooltip: {
valueFormatter: function (value) {
return value + ' °C';
}
},
data: tbData
},
{
name: legendData[2],
type: 'line',
yAxisIndex: 1,
tooltip: {
valueFormatter: function (value) {
return value + ' °C';
}
},
data: hbData
}
]
};
chart.setOption(option);
window.resize = chart.resize();
}
```
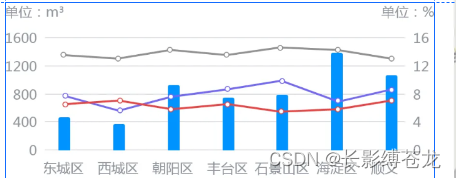
效果图: