数据分析 | 随机森林如何确定参数空间的搜索范围
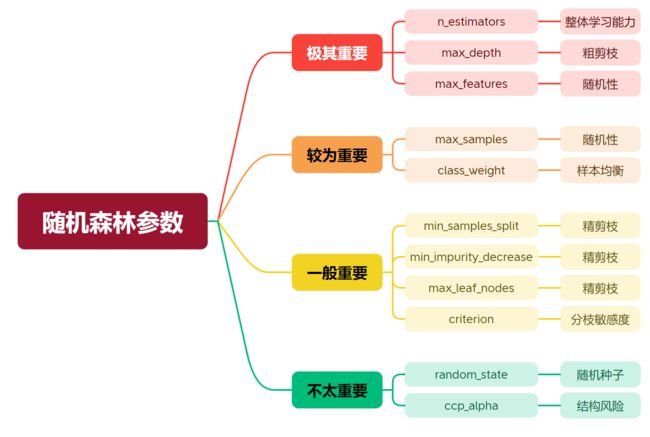
1. 随机森林超参数
极其重要的三个超参数是必须要调整的,一般再加上两到三个其他超参数进行优化即可。
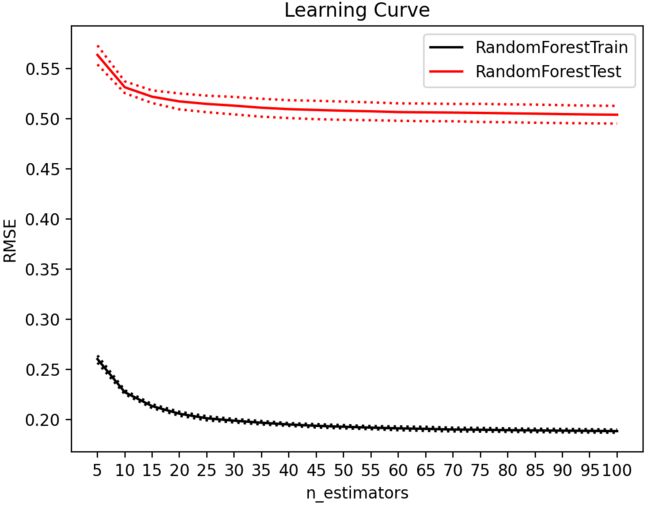
2. 学习曲线确定n_estimators搜索范围
首先导入必要的库,使用sklearn自带的房价预测数据集:
import numpy as np
import pandas as pd
from sklearn.model_selection import train_test_split
from sklearn.datasets import fetch_california_housing
from sklearn.ensemble import RandomForestRegressor
from sklearn.model_selection import KFold
from sklearn.model_selection import cross_validate
import matplotlib.pyplot as plt
housing = fetch_california_housing()
# 特征数据
X = housing.data[:, [0, 1, 2, 3, 4, 5, 6, 7]]
# 目标变量(房价)
y = housing.target
初始化以及5折交叉验证计算RMSE:
trainRMSE = np.array([])
testRMSE = np.array([])
trainSTD = np.array([])
testSTD = np.array([])

Option = range(5,101,5)
for n_estimators in Option :
    reg_f = RandomForestRegressor(n_estimators=n_estimators, random_state=1412)
    # 交叉验证输出结果
    cv = KFold(n_splits=5,shuffle=True,random_state=1412)
    result_f = cross_validate(reg_f,X,y,cv=cv,scoring="neg_mean_squared_error",return_train_score=True,n_jobs=-1)

    # 根据输出的MSE进行RMSE计算
    train = abs(result_f["train_score"])**0.5
    test = abs(result_f["test_score"])**0.5

    trainRMSE = np.append(trainRMSE,train.mean())
    testRMSE = np.append(testRMSE,test.mean())
    trainSTD = np.append(trainSTD,train.std())
    testSTD = np.append(testSTD,test.std())
定义绘图函数:
def plotCVresult(Option,trainRMSE,testRMSE,trainSTD,testSTD) :
    xaxis = Option

    # RMSE
    plt.plot(xaxis, trainRMSE,color='k',label='RandomForestTrain')
    plt.plot(xaxis, testRMSE, color='red', label='RandomForestTest')

    # 将标准差围绕在RMSE旁边,区间越大表示模型越不稳定
    plt.plot(xaxis, trainRMSE + trainSTD, color='k', linestyle='dotted')
    plt.plot(xaxis, trainRMSE - trainSTD, color='k', linestyle='dotted')
    plt.plot(xaxis, testRMSE + testSTD, color='red', linestyle='dotted')
    plt.plot(xaxis, testRMSE - testSTD, color='red', linestyle='dotted')
    plt.xticks([*xaxis])
    plt.legend(loc=1)
    plt.xlabel('n_estimators')
    plt.ylabel('RMSE')
    plt.title('Learning Curve')
    plt.show()

plotCVresult(Option,trainRMSE,testRMSE,trainSTD,testSTD)
输出结果如下:
3. 使用Tree模块判断max_depth搜索范围
只需在输出的最小值和最大值之间进行搜索即可。
reg_f = RandomForestRegressor(n_estimators=100,random_state=1412)
reg_f = reg_f.fit(X,y)
d = pd.Series([],dtype="int64")
for idx,t in enumerate(reg_f.estimators_) :
    d[idx] = t.tree_.max_depth
print('决策树的最大深度的最小值为:',d.min())
print('决策树的最大深度的最大值为:',d.max())
输出结果为:

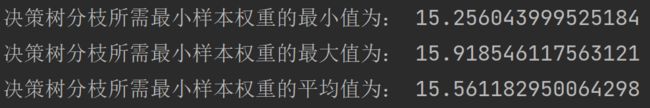
4. 使用Tree模块判断min_weight_fraction_leaf搜索范围
reg_f = RandomForestRegressor(n_estimators=100,random_state=1412)
reg_f = reg_f.fit(X,y)
n = pd.Series([],dtype="int64")
for idx,t in enumerate(reg_f.estimators_) :
    n[idx] = t.tree_.weighted_n_node_samples
meann = np.zeros(20)
for i in range(0,20) :
    meann[i] = n[i].mean()
print('决策树分枝所需最小样本权重的最小值为:',meann.min())
print('决策树分枝所需最小样本权重的最大值为:',meann.max())
print('决策树分枝所需最小样本权重的平均值为:',meann.mean())
输出结果为:
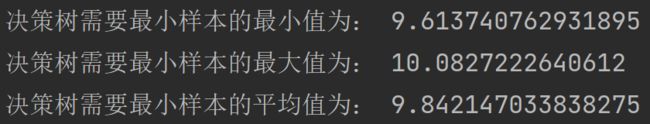
5. 使用Tree模块判断min_sample_split搜索范围
reg_f = RandomForestRegressor(n_estimators=20,random_state=1412)
reg_f = reg_f.fit(X,y)
s = pd.Series([],dtype="int64")
for idx,t in enumerate(reg_f.estimators_) :
    s[idx] = t.tree_.n_node_samples
meann = np.zeros(20)
for i in range(0,20) :
    meann[i] = s[i].mean()
print('决策树需要最小样本的最小值为:',meann.min())
print('决策树需要最小样本的最大值为:',meann.max())
print('决策树需要最小样本的平均值为:',meann.mean())
输出结果为: