highCharts图表应用-实现多种图表的显示
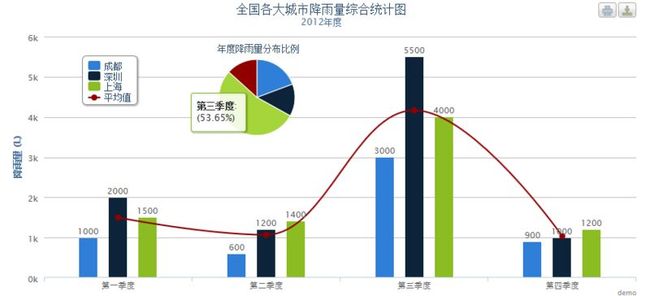
在数据统计和分析业务中,有时需要在一个图表中将柱状图、饼状图、曲线图的都体现出来,即可以从柱状图中看出具体数据、又能从曲线图中看出变化趋势,还能从饼状图中看出各部分数据比重。highCharts可以轻松实现三图合一的效果。
还是以刚才降雨量为例,如果没有highCharts基础,请先参考“highCharts如何使用-强大的图表库插件”。和上个例子相比,修改的地方只有js,所以着重点在js代码上面。这个例子主要是实现柱状图、折线图和饼图结合在一起的用法。
|
1
2
3
4
5
6
7
8
9
10
11
12
13
14
15
16
17
18
19
20
21
22
23
24
25
26
27
28
29
30
31
32
33
34
35
36
37
38
39
40
41
42
43
44
45
46
47
48
49
50
51
52
53
54
55
56
57
58
59
60
61
62
63
64
65
66
67
68
69
70
71
72
73
74
75
76
77
78
79
80
81
82
83
84
85
86
87
88
89
90
91
92
93
94
95
96
97
98
99
100
101
102
103
104
105
106
107
108
109
110
111
112
113
114
115
116
117
118
|
$(
function
() {
new
Highcharts.Chart({
chart : {
renderTo :
'gridTable'
,
// 放置图表的DIV容器对应页面的id属性
},
title : {
text :
'全国各大城市降雨量综合统计图'
// 图表标题
},
subtitle : {
text :
'2012年度'
// 副标题
},
// x轴
xAxis : {
categories : [
'第一季度'
,
'第二季度'
,
'第三季度'
,
'第四季度'
, ]
},
// 右下角显示的LOGO
credits : {
text :
'demo'
,
// 设置LOGO区文字
},
// 是否启用导出功能,默认为true
exporting : {
enabled :
true
},
// y轴
yAxis : {
min : 0,
title : {
text :
'降雨量 (L)'
}
},
legend : {
layout :
'vertical'
,
backgroundColor :
'#FFFFFF'
,
align :
'left'
,
verticalAlign :
'top'
,
x : 100,
y : 70,
floating :
true
,
shadow :
true
},
// 当鼠标悬置数据点时的格式化提示
tooltip : {
formatter :
function
() {
var
temp;
if
(
this
.point.name) {
// 饼状图
temp =
'<b>'
+
this
.point.name +
'</b>: <br>('
+
this
.y
+
'%)'
;
}
else
{
temp =
''
+
this
.x +
': '
+
this
.y +
'L'
;
}
return
temp;
}
},
plotOptions : {
column : {
dataLabels : {
enabled :
true
},
pointPadding : 0.2,
borderWidth : 0
}
},
// 图表标签
labels : {
items : [ {
html :
'年度降雨量分布比例'
,
style : {
left :
'228px'
,
top :
'8px'
}
} ]
},
// 显示的数据,JSON数据格式,最重要的是name和data元素
series : [ {
type :
'column'
,
name :
'成都'
,
data : [ 1000, 600, 3000, 900 ]
}, {
type :
'column'
,
name :
'深圳'
,
data : [ 2000, 1200, 5500, 1000 ]
}, {
type :
'column'
,
name :
'上海'
,
data : [ 1500, 1400, 4000, 1200 ]
}, {
type :
'spline'
,
name :
'平均值'
,
data : [ 1500, 1066.67, 4166.67, 1033.33 ]
}, {
// 饼图
type :
'pie'
,
name :
'年度降雨量分布'
,
data : [ {
name :
'第一季度'
,
y : 19.31
}, {
name :
'第二季度'
,
y : 13.73,
}, {
name :
'第三季度'
,
y : 53.65,
}, {
name :
'第四季度'
,
y : 13.31,
} ],
// 饼状图坐标
center : [ 260, 60 ],
// 饼状图直径大小
size : 100,
dataLabels : {
// 不显示饼状图数据标签
enabled :
false
}
}]
});
});
|
现在的效果就不像刚才的那么单调了。三种图标结合在一起分析数据还是比较直观。效果图:
从上面的例子可以看出,要想在一个图表中(柱状图)加入多种图表形式(曲线图、饼状图等),关键在于设置选项:series(数据列)中的type属性,从上述代码中可以看出,设置column、spline、pie类型表示不同的图表,而在设置饼状图(pie)中,需要设置饼状图的坐标以及大小,调整位置,这样可以使得整个图表显得更加美观。
原创文章,转载请注明: 转载自java开发者
本文链接地址: highCharts图表应用-实现多种图表的显示
