Python-OpenCV-直方图处理
文章目录
- 前言
- 一、直方图是什么?
- 二、使用步骤
-
- 1.绘制直方图
- 2.使用掩膜进行直方图绘制
- 3.彩色图像直方图均衡化
- 4.直方图阈值法
- 总结
前言
随着人工智能的不断发展,OpenCV这门技术也越来越重要,很多人都开启了学习OpenCV,本文就介绍了OpenCV的基础内容。
一、直方图是什么?
通过直方图你可以对整幅图像的灰度分布有一个整体的了解。
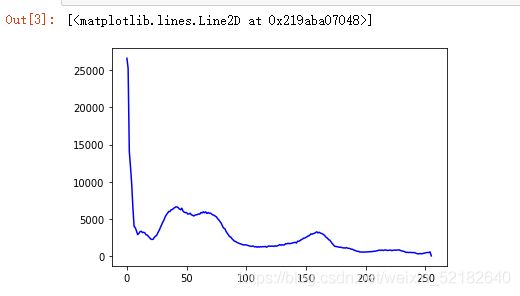
直方图的 x 轴是灰度值(0 到 255),y 轴是图片中具有同一个灰度值的点的数目。
直方图其实就是对图像的另一种解释。一下图为例,通过直方图我们可以对图像的对比度,亮度,灰度分布等有一个直观的认识。几乎所有的图像处理 软件都提供了直方图分析功能。
直方图示意图如下:

二、使用步骤
1.绘制直方图
hist = cv2.calcHist( images, channels, mask, histSize, ranges, accumulate )
代码如下(示例):
 #!/usr/bin/env python
 # -*- coding: utf-8 -*-
 #author:Kong DeXing
 #案例:Fu Xianjun. All Rights Reserved.
import cv2
import numpy as np
img=cv2.imread("bd.jpg")
hist = cv2.calcHist([img],[0],None,[256],[0,255])
plt.plot(hist,color='b')
2.使用掩膜进行直方图绘制
 #!/usr/bin/env python
 # -*- coding: utf-8 -*-
 #author:Kong DeXing
 #案例:Fu Xianjun. All Rights Reserved.
import cv2
import numpy as np
import matplotlib.pyplot as plt
img=cv2.imread("hj.jpg",0)
w,h=img.shape
mask=np.zeros([w,h],np.uint8)
mask[(w-200):w,0:200]=255
hist = cv2.calcHist([img],[0],None,[256],[0,255])
hist_mask = cv2.calcHist([img],[0],mask,[256],[0,255])
 # cv2.imshow('mask',mask)
plt.plot(hist,color='b')
plt.plot(hist_mask,color='g')
cv2.waitKey()
cv2.destroyAllWindows()
3.彩色图像直方图均衡化
 #!/usr/bin/env python
 # -*- coding: utf-8 -*-
 #author:Kong DeXing
 #案例:Fu Xianjun. All Rights Reserved.
import cv2
import numpy as np
img=cv2.imread("qb.jpg")
b,g,r=cv2.split(img)
equb=cv2.equalizeHist(b)
equg=cv2.equalizeHist(g)
equr=cv2.equalizeHist(r)
img_new=cv2.merge([equb,equg,equr])
histb = cv2.calcHist([img_new],[0],None,[256],[0,255])
histg = cv2.calcHist([img_new],[1],None,[256],[0,255])
histr = cv2.calcHist([img_new],[2],None,[256],[0,255])
plt.plot(histb,color='b')
plt.plot(histg,color='g')
plt.plot(histr,color='r')
cv2.imshow("img",img)
cv2.imshow("img_new",img_new)
cv2.waitKey()
cv2.destroyAllWindows()
4.直方图阈值法
 #!/usr/bin/env python
 # -*- coding: utf-8 -*-
 #author:Kong DeXing
 #案例:Fu Xianjun. All Rights Reserved.
import cv2
import numpy as np


 #计算灰度直方图
def calcGrayHist(grayimage):
    #灰度图像矩阵的高,宽
    rows, cols = grayimage.shape
    print(grayimage.shape)
    #存储灰度直方图
    grayHist = np.zeros([256],np.uint64)
    for r in range(rows):
        for c in range(cols):
            grayHist[grayimage[r][c]] += 1
    return grayHist


 #阈值分割:直方图阈值法
def threshTwoPeaks(image):
    if len(image.shape) == 2:
        gray = image
    else:
        gray = cv2.cvtColor(image, cv2.COLOR_BGR2GRAY)
        print(666666)
    #计算灰度直方图
    histogram = calcGrayHist(gray)
    #寻找灰度直方图的最大峰值对应的灰度值
    maxLoc = np.where(histogram==np.max(histogram))
    firstPeak = maxLoc[0][0]
    #寻找灰度直方图的第二个峰值对应的灰度值
    measureDists = np.zeros([256],np.float32)
    for k in range(256):
        measureDists[k] = pow(k-firstPeak,2)*histogram[k]
    maxLoc2 = np.where(measureDists==np.max(measureDists))
    secondPeak = maxLoc2[0][0]

    #找到两个峰值之间的最小值对应的灰度值,作为阈值
    thresh = 0
    if firstPeak > secondPeak:#第一个峰值再第二个峰值的右侧
        temp = histogram[int(secondPeak):int(firstPeak)]
        minloc = np.where(temp == np.min(temp))
        thresh = secondPeak + minloc[0][0] + 1
    else:#第一个峰值再第二个峰值的左侧
        temp = histogram[int(firstPeak):int(secondPeak)]
        minloc = np.where(temp == np.min(temp))
        thresh =firstPeak + minloc[0][0] + 1

    #找到阈值之后进行阈值处理,得到二值图
    threshImage_out = gray.copy()
    #大于阈值的都设置为255
    threshImage_out[threshImage_out > thresh] = 255
    threshImage_out[threshImage_out <= thresh] = 0
    return thresh, threshImage_out
if __name__ == "__main__":
    img = cv2.imread('dog2.png')
    thresh,threshImage_out = threshTwoPeaks(img)
    print(thresh)
    cv2.imshow('threshImage_out',threshImage_out)
    cv2.waitKey(0)
    cv2.destroyAllWindows()
总结
以上就是今天要讲的内容,本文仅仅简单介绍了OpenCV直方图的使用,而直方图提供了大量能使我们快速便捷地处理数据的函数和方法。


