- 基于 matplotlib module 的物理示意图绘制
# 创建画布和子图
fig, ax = plt.subplots()

# 去除 x 轴和 y 轴的边框线
ax.spines['bottom'].set_visible(False)
ax.spines['top'].set_visible(False)
ax.spines['left'].set_visible(False)
ax.spines['right'].set_visible(False)

# 隐藏 x 轴和 y 轴的刻度线和刻度标签
ax.xaxis.set_ticks([])
ax.yaxis.set_ticks([])

# 设置坐标轴范围
ax.set_xlim([0, 15])
ax.set_ylim([0, 15])
matplotlib.patches 模块
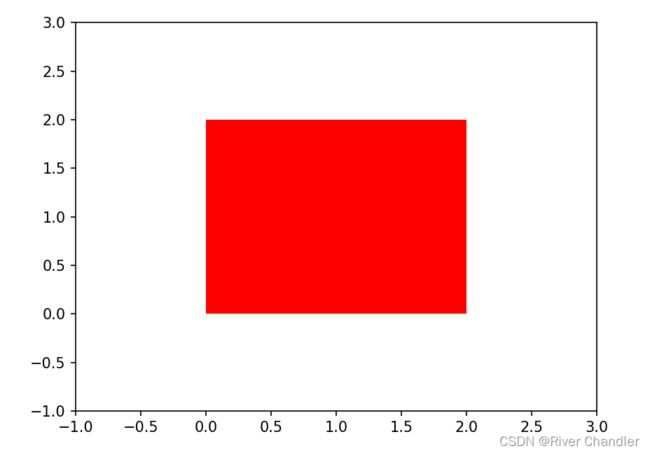
Rectangle 类
import matplotlib.pyplot as plt
import matplotlib.patches as patches
rect = patches.Rectangle((0, 0), 2, 2, facecolor='red')

fig, ax = plt.subplots()
clip_rect = patches.Rectangle((0.5, 0.5), 0.1, 0.1)

rect.set_clip_path(clip_rect)

ax.add_patch(rect)

ax.set_xlim(-1, 3)
ax.set_ylim(-1, 3)

# 显示图形
plt.pause(0.01)
Circle 类
import matplotlib.pyplot as plt
import matplotlib.patches as patches
rect = patches.Rectangle((0, 0), 2, 2, facecolor='red')

fig, ax = plt.subplots()
circle = patches.Circle((0, 0), 1)
circle.set_edgecolor('red')
circle.set_facecolor('blue')
circle.set_linewidth(2)


ax.add_patch(circle)

ax.set_xlim(-1, 3)
ax.set_ylim(-1, 3)

# 显示图形
plt.pause(0.01)

Ellipse 类
Polygon 类
Wedge 类
FancyArrowPatch 类
# 绘制曲线
x = [1, 2, 3, 4, 5]
y = [2, 5, 4, 8, 1]
ax.plot(x, y)

# 添加弯曲箭头
start = (2, 4)  # 箭头起始点坐标
end = (5, 10)  # 箭头结束点坐标

# 使用FancyArrow类绘制弯曲箭头
arrow1 = FancyArrowPatch(start, end,
                            connectionstyle='arc3, rad=-0.4',  # 设置弯曲箭头的样式和曲率
                            mutation_scale=10,  # 控制箭头大小
                            color="red")

arrow2 = FancyArrowPatch(start, end,
                            connectionstyle='angle3, angleA=-60, angleB=-10  ',  # 设置弯曲箭头的样式和曲率
                            mutation_scale=10,  # 控制箭头大小
                            color="blue")


# 添加箭头到图中
ax.add_patch(arrow1)
ax.add_patch(arrow2)

# 显示图形
plt.pause(0.01)
