用户名和KEY请到www.xxweixin.com获取
python实现自动化sql布尔盲注(二分查找)
海星船长丶
python自动化sql网络安全web安全
为了优化自动化布尔盲注的代码,我们可以使用二分查找来减少猜测次数,从而提高效率。以靶场sqli为例:importrequests#目标URLurl="http://127.0.0.1/sqli/Less-8/index.php"#要推断的数据库信息(例如:数据库名)database_name=""#字符集(可以根据需要扩展)charset="abcdefghijklmnopqrstuvwxyzAB
cm3d2 & com3d2
HECUgauss
Kiss经验分享游戏程序
新增一个分类,因为旧做cm3d2有些插件是可以通用的,标注CM3D2的就是理论上旧做也能用的(但我手上没有cm3d2所以只是理论上)网站Hgamewikicom3d2分区CustomMaid3D2-HgamesWiki(anime-sharing.com)https://wiki.anime-sharing.com/hgames/index.php?title=Custom_Maid_3D2中文資
新一代会员分销返利小程序,聚合cps系统独立部署,对接20多个CPA/CPS资源
+V:ywxs5787
小程序开发cps分销软件开发小程序uniapp微信小程序
技术栈前端:vue3+uniapp后端:PHP数据库:MySQL一、系统介绍PHP部分代码'value1','param2'=>'value2',//添加其他参数];//发送HTTPPOST请求$ch=curl_init();curl_setopt($ch,CURLOPT_URL,$url);curl_setopt($ch,CURLOPT_POST,true);curl_setopt($ch,CU
《Cocos2d-x实战 Lua卷》上线了
感谢大家一直以来的支持!各大商店均开始销售:京东:http://item.jd.com/11659697.html当当:http://product.dangdang.com/23659810.html《Cocos2d-x实战Lua卷》源码及样章下载地址:源码下载地址:http://51work6.com/forum.php?mod=viewthread&tid=1198&extra=page%3
Uniapp微信小程序开发:后端服务器搭建指南(语言选择+部署方案)
目录前言:Uniapp+微信小程序的架构模式️后端服务器的作用后端语言选择(Node.js/Java/Python/PHP/Go)☁️服务器部署方案(云服务器vsServerless)实战:如何连接Uniapp与后端API安全优化:HTTPS、JWT、接口鉴权数据库选择(MySQL、MongoDB、云数据库)总结&最佳实践1.前言:Uniapp+微信小程序的架构模式Uniapp是一个基于Vue.j
web的跨域问题--针对CSP的内容
SunnyZHQing
系统问题web跨域
跨域的ajax问题是因为返回的response中缺少Header("Access-Control-Allow-Origin","*")Header("Access-Control-Allow-Methods","GET,POST")Header("Access-Control-Allow-Headers","x-requested-with,content-type")需要把这写代码写到1.php
PHP面向对象进阶:抽象类、接口与类型声明
软考和人工智能学堂
PHP和MySQLphp程序设计android前端
引言在PHP面向对象编程中,抽象类、接口和类型声明是构建可扩展、可维护应用程序的重要工具。本文将深入探讨这些概念,展示它们如何帮助开发者创建更健壮的代码结构。抽象类(AbstractClasses)抽象类是不能被实例化的类,它定义了子类必须实现的方法模板。基本抽象类示例abstractclassAnimal{protected$name;publicfunction__construct($nam
小程序源码:全新超火的微信小说小程序源码-自带采集带安装教程-多玩法安装简单
哔咔app下载入口
微信小程序源码教程小程序源码小程序微信微信小程序
下面给大家带来一款最近超火的一款微信小说小程序源码本套源码自带采集,拿到手的时候没有安装教程不过小编在测试的时候给大家把安装教程给补上了安装教程:PHP选择5.6以上的版本上传我们的后端解压伪静态选择thinkphp修改数据库链接文件config/database.php然后我们导入数据库后台点击小程序把你的小程序该设置的设置就可以了小说的话就点击数据采集然后采集就可以了小程序首页轮播推荐和首页分
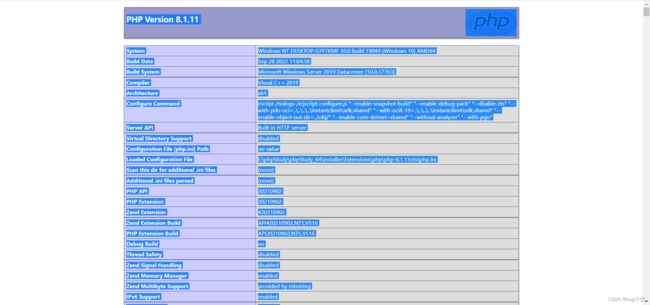
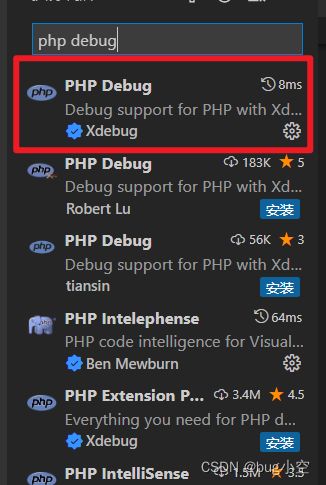
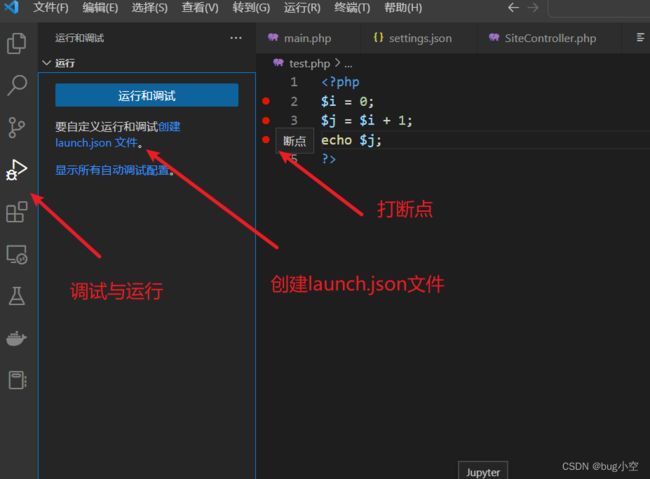
手动搭建PHP环境:步步为营,解锁Web开发
奔跑吧邓邓子
项目攻略php手动搭建php环境
目录一、引言二、准备工作2.1明确所需软件2.2下载软件三、Windows系统搭建步骤3.1安装Apache服务器3.2安装PHP3.3集成Apache与PHP3.4安装MySQL3.5配置PHP连接MySQL四、Linux系统搭建步骤(以Ubuntu为例)4.1更新系统4.2安装Apache4.3安装MySQL或MariaDB4.4安装PHP及其扩展五、macOS系统搭建步骤5.1安装Homeb
java毕业设计-基于Javaweb的家常小菜烹饪学习管理系统的设计与实现(源码+LW+部署文档+全bao+远程调试+代码讲解等)
程序猿刘
vuespringboot毕业设计java课程设计学习
博主介绍:✌️码农一枚,专注于大学生项目实战开发、讲解和毕业文撰写修改等。全栈领域优质创作者,博客之星、掘金/华为云/阿里云/InfoQ等平台优质作者、专注于Java、小程序技术领域和毕业项目实战✌️技术范围::小程序、SpringBoot、SSM、JSP、Vue、PHP、Java、python、爬虫、数据可视化、大数据、物联网、机器学习等设计与开发。主要内容:免费开题报告、任务书、全bao定制+
java毕业设计源码案例-基于ssm+协同过滤的个性化小说推荐系统设计与实现(源码+LW+部署文档+全bao+远程调试+代码讲解等)
项目帮
springbootjava计算机毕设java课程设计开发语言
博主介绍:✌️码农一枚,专注于大学生项目实战开发、讲解和毕业文撰写修改等。全栈领域优质创作者,博客之星、掘金/华为云/阿里云/InfoQ等平台优质作者、专注于Java、小程序技术领域和毕业项目实战✌️技术范围::小程序、SpringBoot、SSM、JSP、Vue、PHP、Java、python、爬虫、数据可视化、大数据、物联网、机器学习等设计与开发。主要内容:免费功能设计,开题报告、任务书、全b
计算机专业大数据毕业设计-基于 Spark 的音乐数据分析项目(源码+LW+部署文档+全bao+远程调试+代码讲解等)
程序猿八哥
数据可视化计算机毕设spark大数据课程设计spark
博主介绍:✌️码农一枚,专注于大学生项目实战开发、讲解和毕业文撰写修改等。全栈领域优质创作者,博客之星、掘金/华为云/阿里云/InfoQ等平台优质作者、专注于Java、小程序技术领域和毕业项目实战✌️技术范围::小程序、SpringBoot、SSM、JSP、Vue、PHP、Java、python、爬虫、数据可视化、大数据、物联网、机器学习等设计与开发。主要内容:免费功能设计,开题报告、任务书、全b
PHP 面试题
狮子座鲸鱼
php开发语言
一、PHP新版本特性PHP7是一个重大版本,引入了许多新特性和性能优化,比如返回类型声明、泛型、异步函数、NUllable类型和标量类型声明等。PHP8(2018-今)PHP8引入了许多新特性和改进,在性能上有大幅提升,包括Just-in-Time(JIT)编译器、属性的初始化简化语法、UnionTypes(联合类型)等二、http状态码HTTP协议中几个状态码的含义:1xx(临时响应)表示临时响
PHP 性能优化全攻略:提升 Web 应用速度的关键
来恩1003
PHP从入门到精通php性能优化前端
PHP学习资料PHP学习资料PHP学习资料在Web开发领域,PHP凭借其简单易用、开源免费等特性,成为众多开发者构建网站和应用的首选语言。然而,随着业务的发展和用户量的增加,PHP应用的性能问题逐渐凸显。性能不佳不仅会导致用户体验下降,还可能影响业务的发展。因此,对PHP代码进行性能优化至关重要。本文将深入探讨PHP性能优化的各个方面,包括缓存的使用、代码优化策略以及服务器配置优化等,帮助开发者打
深入浅出Java Annotation(元注解和自定义注解)
Josh_Persistence
Java Annotation元注解自定义注解
一、基本概述
Annontation是Java5开始引入的新特征。中文名称一般叫注解。它提供了一种安全的类似注释的机制,用来将任何的信息或元数据(metadata)与程序元素(类、方法、成员变量等)进行关联。
更通俗的意思是为程序的元素(类、方法、成员变量)加上更直观更明了的说明,这些说明信息是与程序的业务逻辑无关,并且是供指定的工具或
mysql优化特定类型的查询
annan211
java工作mysql
本节所介绍的查询优化的技巧都是和特定版本相关的,所以对于未来mysql的版本未必适用。
1 优化count查询
对于count这个函数的网上的大部分资料都是错误的或者是理解的都是一知半解的。在做优化之前我们先来看看
真正的count()函数的作用到底是什么。
count()是一个特殊的函数,有两种非常不同的作用,他可以统计某个列值的数量,也可以统计行数。
在统
MAC下安装多版本JDK和切换几种方式
棋子chessman
jdk
环境:
MAC AIR,OS X 10.10,64位
历史:
过去 Mac 上的 Java 都是由 Apple 自己提供,只支持到 Java 6,并且OS X 10.7 开始系统并不自带(而是可选安装)(原自带的是1.6)。
后来 Apple 加入 OpenJDK 继续支持 Java 6,而 Java 7 将由 Oracle 负责提供。
在终端中输入jav
javaScript (1)
Array_06
JavaScriptjava浏览器
JavaScript
1、运算符
运算符就是完成操作的一系列符号,它有七类: 赋值运算符(=,+=,-=,*=,/=,%=,<<=,>>=,|=,&=)、算术运算符(+,-,*,/,++,--,%)、比较运算符(>,<,<=,>=,==,===,!=,!==)、逻辑运算符(||,&&,!)、条件运算(?:)、位
国内顶级代码分享网站
袁潇含
javajdkoracle.netPHP
现在国内很多开源网站感觉都是为了利益而做的
当然利益是肯定的,否则谁也不会免费的去做网站
&
Elasticsearch、MongoDB和Hadoop比较
随意而生
mongodbhadoop搜索引擎
IT界在过去几年中出现了一个有趣的现象。很多新的技术出现并立即拥抱了“大数据”。稍微老一点的技术也会将大数据添进自己的特性,避免落大部队太远,我们看到了不同技术之间的边际的模糊化。假如你有诸如Elasticsearch或者Solr这样的搜索引擎,它们存储着JSON文档,MongoDB存着JSON文档,或者一堆JSON文档存放在一个Hadoop集群的HDFS中。你可以使用这三种配
mac os 系统科研软件总结
张亚雄
mac os
1.1 Microsoft Office for Mac 2011
大客户版,自行搜索。
1.2 Latex (MacTex):
系统环境:https://tug.org/mactex/
&nb
Maven实战(四)生命周期
AdyZhang
maven
1. 三套生命周期 Maven拥有三套相互独立的生命周期,它们分别为clean,default和site。 每个生命周期包含一些阶段,这些阶段是有顺序的,并且后面的阶段依赖于前面的阶段,用户和Maven最直接的交互方式就是调用这些生命周期阶段。 以clean生命周期为例,它包含的阶段有pre-clean, clean 和 post
Linux下Jenkins迁移
aijuans
Jenkins
1. 将Jenkins程序目录copy过去 源程序在/export/data/tomcatRoot/ofctest-jenkins.jd.com下面 tar -cvzf jenkins.tar.gz ofctest-jenkins.jd.com &
request.getInputStream()只能获取一次的问题
ayaoxinchao
requestInputstream
问题:在使用HTTP协议实现应用间接口通信时,服务端读取客户端请求过来的数据,会用到request.getInputStream(),第一次读取的时候可以读取到数据,但是接下来的读取操作都读取不到数据
原因: 1. 一个InputStream对象在被读取完成后,将无法被再次读取,始终返回-1; 2. InputStream并没有实现reset方法(可以重
数据库SQL优化大总结之 百万级数据库优化方案
BigBird2012
SQL优化
网上关于SQL优化的教程很多,但是比较杂乱。近日有空整理了一下,写出来跟大家分享一下,其中有错误和不足的地方,还请大家纠正补充。
这篇文章我花费了大量的时间查找资料、修改、排版,希望大家阅读之后,感觉好的话推荐给更多的人,让更多的人看到、纠正以及补充。
1.对查询进行优化,要尽量避免全表扫描,首先应考虑在 where 及 order by 涉及的列上建立索引。
2.应尽量避免在 where
jsonObject的使用
bijian1013
javajson
在项目中难免会用java处理json格式的数据,因此封装了一个JSONUtil工具类。
JSONUtil.java
package com.bijian.json.study;
import java.util.ArrayList;
import java.util.Date;
import java.util.HashMap;
[Zookeeper学习笔记之六]Zookeeper源代码分析之Zookeeper.WatchRegistration
bit1129
zookeeper
Zookeeper类是Zookeeper提供给用户访问Zookeeper service的主要API,它包含了如下几个内部类
首先分析它的内部类,从WatchRegistration开始,为指定的znode path注册一个Watcher,
/**
* Register a watcher for a particular p
【Scala十三】Scala核心七:部分应用函数
bit1129
scala
何为部分应用函数?
Partially applied function: A function that’s used in an expression and that misses some of its arguments.For instance, if function f has type Int => Int => Int, then f and f(1) are p
Tomcat Error listenerStart 终极大法
ronin47
tomcat
Tomcat报的错太含糊了,什么错都没报出来,只提示了Error listenerStart。为了调试,我们要获得更详细的日志。可以在WEB-INF/classes目录下新建一个文件叫logging.properties,内容如下
Java代码
handlers = org.apache.juli.FileHandler, java.util.logging.ConsoleHa
不用加减符号实现加减法
BrokenDreams
实现
今天有群友发了一个问题,要求不用加减符号(包括负号)来实现加减法。
分析一下,先看最简单的情况,假设1+1,按二进制算的话结果是10,可以看到从右往左的第一位变为0,第二位由于进位变为1。
读《研磨设计模式》-代码笔记-状态模式-State
bylijinnan
java设计模式
声明: 本文只为方便我个人查阅和理解,详细的分析以及源代码请移步 原作者的博客http://chjavach.iteye.com/
/*
当一个对象的内在状态改变时允许改变其行为,这个对象看起来像是改变了其类
状态模式主要解决的是当控制一个对象状态的条件表达式过于复杂时的情况
把状态的判断逻辑转移到表示不同状态的一系列类中,可以把复杂的判断逻辑简化
如果在
CUDA程序block和thread超出硬件允许值时的异常
cherishLC
CUDA
调用CUDA的核函数时指定block 和 thread大小,该大小可以是dim3类型的(三维数组),只用一维时可以是usigned int型的。
以下程序验证了当block或thread大小超出硬件允许值时会产生异常!!!GPU根本不会执行运算!!!
所以验证结果的正确性很重要!!!
在VS中创建CUDA项目会有一个模板,里面有更详细的状态验证。
以下程序在K5000GPU上跑的。
诡异的超长时间GC问题定位
chenchao051
jvmcmsGChbaseswap
HBase的GC策略采用PawNew+CMS, 这是大众化的配置,ParNew经常会出现停顿时间特别长的情况,有时候甚至长到令人发指的地步,例如请看如下日志:
2012-10-17T05:54:54.293+0800: 739594.224: [GC 739606.508: [ParNew: 996800K->110720K(996800K), 178.8826900 secs] 3700
maven环境快速搭建
daizj
安装mavne环境配置
一 下载maven
安装maven之前,要先安装jdk及配置JAVA_HOME环境变量。这个安装和配置java环境不用多说。
maven下载地址:http://maven.apache.org/download.html,目前最新的是这个apache-maven-3.2.5-bin.zip,然后解压在任意位置,最好地址中不要带中文字符,这个做java 的都知道,地址中出现中文会出现很多
PHP网站安全,避免PHP网站受到攻击的方法
dcj3sjt126com
PHP
对于PHP网站安全主要存在这样几种攻击方式:1、命令注入(Command Injection)2、eval注入(Eval Injection)3、客户端脚本攻击(Script Insertion)4、跨网站脚本攻击(Cross Site Scripting, XSS)5、SQL注入攻击(SQL injection)6、跨网站请求伪造攻击(Cross Site Request Forgerie
yii中给CGridView设置默认的排序根据时间倒序的方法
dcj3sjt126com
GridView
public function searchWithRelated() {
$criteria = new CDbCriteria;
$criteria->together = true; //without th
Java集合对象和数组对象的转换
dyy_gusi
java集合
在开发中,我们经常需要将集合对象(List,Set)转换为数组对象,或者将数组对象转换为集合对象。Java提供了相互转换的工具,但是我们使用的时候需要注意,不能乱用滥用。
1、数组对象转换为集合对象
最暴力的方式是new一个集合对象,然后遍历数组,依次将数组中的元素放入到新的集合中,但是这样做显然过
nginx同一主机部署多个应用
geeksun
nginx
近日有一需求,需要在一台主机上用nginx部署2个php应用,分别是wordpress和wiki,探索了半天,终于部署好了,下面把过程记录下来。
1. 在nginx下创建vhosts目录,用以放置vhost文件。
mkdir vhosts
2. 修改nginx.conf的配置, 在http节点增加下面内容设置,用来包含vhosts里的配置文件
#
ubuntu添加admin权限的用户账号
hongtoushizi
ubuntuuseradd
ubuntu创建账号的方式通常用到两种:useradd 和adduser . 本人尝试了useradd方法,步骤如下:
1:useradd
使用useradd时,如果后面不加任何参数的话,如:sudo useradd sysadm 创建出来的用户将是默认的三无用户:无home directory ,无密码,无系统shell。
顾应该如下操作:
第五章 常用Lua开发库2-JSON库、编码转换、字符串处理
jinnianshilongnian
nginxlua
JSON库
在进行数据传输时JSON格式目前应用广泛,因此从Lua对象与JSON字符串之间相互转换是一个非常常见的功能;目前Lua也有几个JSON库,本人用过cjson、dkjson。其中cjson的语法严格(比如unicode \u0020\u7eaf),要求符合规范否则会解析失败(如\u002),而dkjson相对宽松,当然也可以通过修改cjson的源码来完成
Spring定时器配置的两种实现方式OpenSymphony Quartz和java Timer详解
yaerfeng1989
timerquartz定时器
原创整理不易,转载请注明出处:Spring定时器配置的两种实现方式OpenSymphony Quartz和java Timer详解
代码下载地址:http://www.zuidaima.com/share/1772648445103104.htm
有两种流行Spring定时器配置:Java的Timer类和OpenSymphony的Quartz。
1.Java Timer定时
首先继承jav
Linux下df与du两个命令的差别?
pda158
linux
一、df显示文件系统的使用情况,与du比較,就是更全盘化。 最经常使用的就是 df -T,显示文件系统的使用情况并显示文件系统的类型。 举比例如以下: [root@localhost ~]# df -T Filesystem Type &n
[转]SQLite的工具类 ---- 通过反射把Cursor封装到VO对象
ctfzh
VOandroidsqlite反射Cursor
在写DAO层时,觉得从Cursor里一个一个的取出字段值再装到VO(值对象)里太麻烦了,就写了一个工具类,用到了反射,可以把查询记录的值装到对应的VO里,也可以生成该VO的List。
使用时需要注意:
考虑到Android的性能问题,VO没有使用Setter和Getter,而是直接用public的属性。
表中的字段名需要和VO的属性名一样,要是不一样就得在查询的SQL中
该学习笔记用到的Employee表
vipbooks
oraclesql工作
这是我在学习Oracle是用到的Employee表,在该笔记中用到的就是这张表,大家可以用它来学习和练习。
drop table Employee;
-- 员工信息表
create table Employee(
-- 员工编号
EmpNo number(3) primary key,
-- 姓