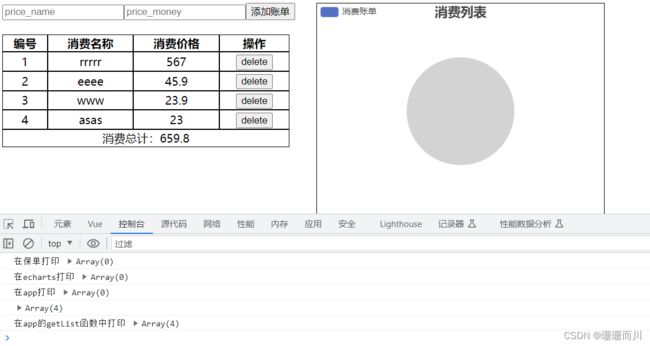
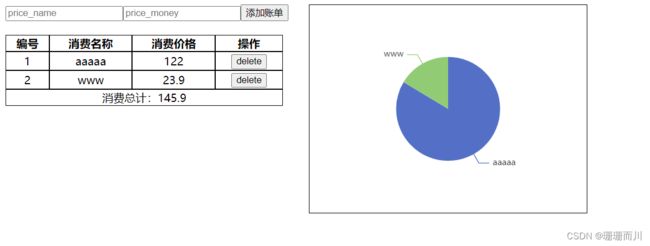
小黑账单 图表渲染失败 父子组件的生命周期钩子函数不会同步调用
项目场景:
问题描述
图表组件中 mounted钩子中获取的list总是空的,表单组件亦然

PayEcharts.vue
<template>
  <div class="payEcharts">
    <div class="right"></div>
  </div>
</template>

<script>
import * as echarts from "echarts";
export default {
    props:{
        list:{
            type:Array
        }
    },
    mounted() {
        console.log('在echarts打印',this.list);

              this.myChart = echarts.init(document.querySelector('.right'))
              this.myChart.setOption({
                  title: {
                      text: '消费列表',

                      left: 'center'
                  },
                  // 提示框
                  tooltip: {
                      trigger: 'item'
                  },

                  // 图例
                  legend: {
                      orient: 'vertical',
                      left: 'left'
                  },
                  series: [
                      {
                          name: '消费账单',
                          type: 'pie',
                          radius: '50%',
                          series:[
                            {
                              data:this.list.map(item=>({value:item.price,name:item.name}))
                            }
                          ],
                          emphasis: {
                              itemStyle: {
                                  shadowBlur: 10,
                                  shadowOffsetX: 0,
                                  shadowColor: 'rgba(0, 0, 0, 0.5)'
                              }
                          }
                      }
                  ]
              })
          },
}
</script>

<style scoped>
 .right{
      width: 400px;
      height: 300px;
      margin-left: 30px;
      border: 1px solid black;
  }
</style>
App.vue
<template>
    <div class="app">
        <PayList @add="addFn" @del="delFn"   :list="list"></PayList>
        <PayEcharts :list="list"></PayEcharts>
    </div>
  </template>
  <script>
  import PayEcharts from './components/PayEcharts.vue';
  import PayList from './components/PayList.vue';
  import axios from 'axios'
//   import * as echarts from "echarts";

   /**
         * 接口文档地址:
         * https://www.apifox.cn/apidoc/shared-24459455-ebb1-4fdc-8df8-0aff8dc317a8/api-53371058
         *
         * 功能需求:
         * 1. 基本渲染
         * 2. 添加功能
         * 3. 删除功能
         * 4. 饼图渲染
         */
  export default {
    components:{
        PayEcharts,PayList
    },
      data(){
          return {
              list:[],
          }
      },


      created(){
          this.getList()
      },
      mounted(){
        console.log('在app打印',this.list);
      },
      methods:{
        async getList(){
              const res=await axios.get('https://applet-base-api-t.itheima.net/bill',{
                  params:{
                      creator:'slx'
                  }
              })
              console.log(res.data.data)
              this.list=res.data.data
              console.log('在app的getList函数中打印',this.list);
            //   this.myChart.setOption({
            //       series:[
            //           {
            //               data:this.list.map(item=>({value:item.price,name:item.name}))
            //           }
            //       ]
            //   })
          },
        async delFn(tt){
              await axios.delete(`https://applet-base-api-t.itheima.net/bill/${tt}`)
              this.getList()
          },

          async addFn(obj){
              const name=obj.name
              const price=obj.price
              if(name==''){
                  return alert ('请输入有效名字')
              }

              await axios.post('https://applet-base-api-t.itheima.net/bill',{
              "creator": 'slx',
              "name": name,
              "price": price
              })

              this.getList()
          }
      }
  }
  </script>

  <style>
  .app{
      display: flex;
  }


  </style>
原因分析:
从你提供的代码中,我注意到可能出现了一个问题,可能导致图表不显示以及list数组获取不到的情况。问题出现在PayEcharts组件的mounted生命周期钩子中。
在PayEcharts组件的mounted钩子中,你尝试初始化 ECharts 实例并设置图表选项。然而,可能在这个时候,this.list 数据还没有被完全传递到子组件。这是因为父组件的mounted钩子会在子组件的mounted钩子之前被调用,因此在PayEcharts的mounted钩子中,this.list 可能尚未被父组件完全初始化。
为了解决这个问题,你可以使用一个 watch 来监听 list 数据的变化,并在 list 数据更新时重新绘制图表。这样可以确保在正确的时机进行图表的初始化和数据渲染。以下是修改后的代码示例:
解决方案:
通过使用 watch 监听 list 数据的变化,你可以确保在数据传递到子组件后再进行图表的初始化和渲染,从而解决可能导致图表不显示的问题。
PayEcharts.vue
<template>
  <div class="payEcharts">
    <div class="right"></div>
  </div>
</template>

<script>
import * as echarts from "echarts";
export default {
    props:{
        list:{
            type:Array
        }
    },
    mounted() {
    this.myChart = echarts.init(document.querySelector('.right'));
    this.renderChart();
  },
  watch: {
    list: {
      immediate: true, // Trigger the watcher immediately on component creation
      handler() {
        this.renderChart();
      },
    },
  },
  methods: {
    renderChart() {
      if (this.myChart && this.list) {  //这个删了会 在最开始有空白,图表为空
        this.myChart.setOption({
          series: [
            {
              name: '消费账单',
              type: 'pie',
              radius: '50%',
              data: this.list.map(item => ({ value: item.price, name: item.name })),
              emphasis: {
                itemStyle: {
                  shadowBlur: 10,
                  shadowOffsetX: 0,
                  shadowColor: 'rgba(0, 0, 0, 0.5)',
                },
              },
            },
          ],
        });
      }
    },
  },

}
</script>

<style scoped>
 .right{
      width: 400px;
      height: 300px;
      margin-left: 30px;
      border: 1px solid black;
  }
</style>
