Python使用pyecharts绘图
python安装pyecharts
pip install pyecharts绘制多坐标轴的图形
import pyecharts.options as opts
from pyecharts.charts import Bar, Line
from pyecharts.render import make_snapshot
from snapshot_selenium import snapshot


colors = ["#5793f3", "#d14a61", "#675bba"]
x_data = ["1月", "2月", "3月", "4月", "5月", "6月", "7月", "8月", "9月", "10月", "11月", "12月"]
legend_list = ["蒸发量", "降水量", "平均温度"]
evaporation_capacity = [ 2.0,    4.9,    7.0,    23.2,    25.6,    76.7,    135.6,    162.2,    32.6,    20.0,    6.4,    3.3,]
rainfall_capacity = [    2.6,    5.9,    9.0,    26.4,    28.7,    70.7,    175.6,    182.2,    48.7,    18.8,    6.0,    2.3,]
average_temperature = [2.0, 2.2, 3.3, 4.5, 6.3, 10.2, 20.3, 23.4, 23.0, 16.5, 12.0, 6.2]


bar = (
    Bar(init_opts=opts.InitOpts(width="1260px", height="720px"))
    .add_xaxis(xaxis_data=x_data)
    .add_yaxis(
        series_name="蒸发量", y_axis=evaporation_capacity, yaxis_index=0, color=colors[1]
    )
    .add_yaxis(
        series_name="降水量", y_axis=rainfall_capacity, yaxis_index=1, color=colors[0]
    )
    .extend_axis(
        yaxis=opts.AxisOpts(
            name="蒸发量",
            type_="value",
            min_=0,
            max_=250,
            position="right",
            axisline_opts=opts.AxisLineOpts(
                linestyle_opts=opts.LineStyleOpts(color=colors[1])
            ),
            axislabel_opts=opts.LabelOpts(formatter="{value} ml"),
        )
    )
    .extend_axis(
        yaxis=opts.AxisOpts(
            type_="value",
            name="温度",
            min_=0,
            max_=25,
            position="left",
            axisline_opts=opts.AxisLineOpts(
                linestyle_opts=opts.LineStyleOpts(color=colors[2])
            ),
            axislabel_opts=opts.LabelOpts(formatter="{value} °C"),
            splitline_opts=opts.SplitLineOpts(
                is_show=True, linestyle_opts=opts.LineStyleOpts(opacity=1)
            ),
        )
    )
    .set_global_opts(
        yaxis_opts=opts.AxisOpts(
            type_="value",
            name="降水量",
            min_=0,
            max_=250,
            position="right",
            offset=80,
            axisline_opts=opts.AxisLineOpts(
                linestyle_opts=opts.LineStyleOpts(color=colors[0])
            ),
            axislabel_opts=opts.LabelOpts(formatter="{value} ml"),
        ),
        tooltip_opts=opts.TooltipOpts(trigger="axis", axis_pointer_type="cross"),
    )
)

line = (
    Line()
    .add_xaxis(xaxis_data=x_data)
    .add_yaxis(
        series_name="平均温度", y_axis=average_temperature, yaxis_index=2, color=colors[2]
    )
)
# 生成网页
bar.overlap(line).render("multiple_y_axes.html")
# 保存图片
make_snapshot(snapshot, bar.overlap(line).render(), "multiple_y_axes-1.png", is_remove_html=True)
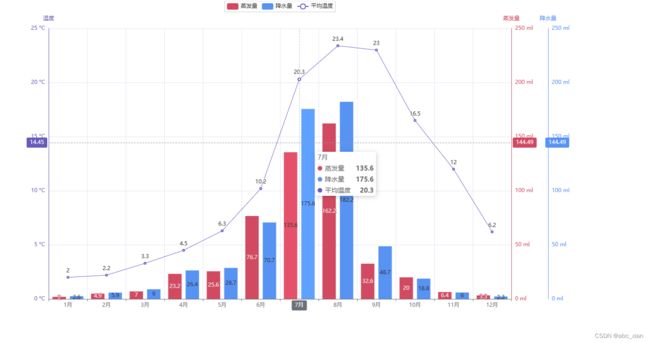
效果展示
网页
图片
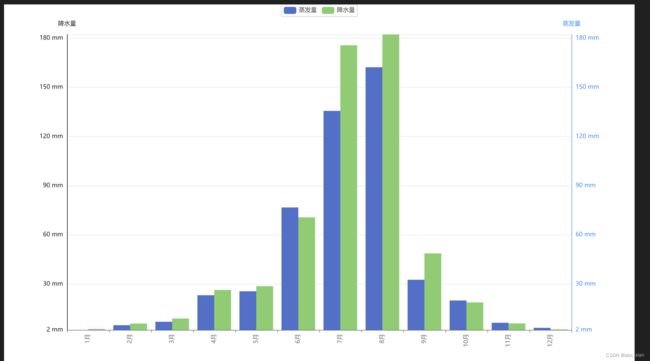
取消分割线
    from pyecharts.charts import Bar
    from pyecharts.render import make_snapshot
    from pyecharts import options as opts
    from snapshot_selenium import snapshot

    symbol = ["1月", "2月", "3月", "4月", "5月", "6月", "7月", "8月", "9月", "10月", "11月", "12月"]

    LV1 = [ 2.0,    4.9,    7.0,    23.2,    25.6,    76.7,    135.6,    162.2,    32.6,    20.0,    6.4,    3.3,]
    LV2 = [ 2.6,    5.9,    9.0,    26.4,    28.7,    70.7,    175.6,    182.2,    48.7,    18.8,    6.0,    2.3,]

    max_y = max(LV1+LV2)
    min_y = min(LV1+LV2)
    bar = (
        Bar(init_opts=opts.InitOpts(width="1260px", height="720px", bg_color="#FFFFFF"))
        .add_xaxis(symbol)
        .add_yaxis("蒸发量", LV1, gap="0%", label_opts=opts.LabelOpts(is_show=True))
        .add_yaxis("降水量", LV2, gap="0%", label_opts=opts.LabelOpts(is_show=True))
        .extend_axis(
            yaxis=opts.AxisOpts(
                type_="value",
                name="蒸发量",
                min_=min_y,
                max_=max_y,
                position="right",
                axisline_opts=opts.AxisLineOpts(
                    linestyle_opts=opts.LineStyleOpts(color="#5793f3")
                ),
                axislabel_opts=opts.LabelOpts(formatter="{value} mm"),
                splitline_opts=opts.SplitLineOpts(
                    is_show=True, linestyle_opts=opts.LineStyleOpts(opacity=1)
                ),
            )
        )
        .set_series_opts(
            label_opts=opts.LabelOpts(is_show=False)
        )
        .set_global_opts(
            yaxis_opts=opts.AxisOpts(
                type_="value",
                name="降水量",
                min_=min_y,
                max_=max_y,
                position="left",
                axisline_opts=opts.AxisLineOpts(
                    linestyle_opts=opts.LineStyleOpts(color="#000000")
                ),
                axislabel_opts=opts.LabelOpts(formatter="{value} mm"),
                splitline_opts=opts.SplitLineOpts(
                    is_show=True, linestyle_opts=opts.LineStyleOpts(opacity=1)
                )
            ),
            xaxis_opts=opts.AxisOpts(
                axislabel_opts=opts.LabelOpts(
                    rotate=90
                ),
                # axisline_opts=opts.AxisLineOpts(is_on_zero=True),
                splitline_opts=opts.SplitLineOpts(is_show=False),
            )
        )
    )

    # bar.render('TEST-HTML.html')
    make_snapshot(snapshot, bar.render(), "test-1.png", is_remove_html=True)
保存效果展示


