(实战)sklearn----多元线性回归&sklearn----多项式回归
import numpy as np
from numpy import genfromtxt
from sklearn import linear_model
import matplotlib.pyplot as plt
from mpl_toolkits.mplot3d import Axes3D
# 读入数据
data = genfromtxt(r"Delivery.csv",delimiter=',')
print(data)
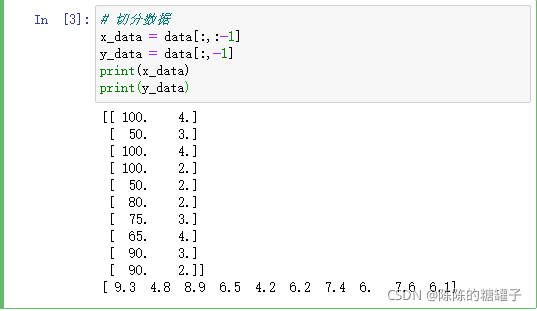
# 切分数据
x_data = data[:,:-1]
y_data = data[:,-1]
print(x_data)
print(y_data)
# 引用模型
model = linear_model.LinearRegression()
model.fit(x_data, y_data)
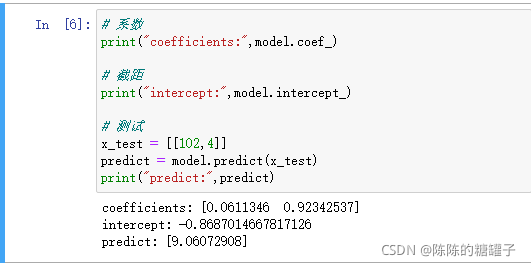
# 系数
print("coefficients:",model.coef_)

# 截距
print("intercept:",model.intercept_)

# 测试
x_test = [[102,4]]
predict = model.predict(x_test)
print("predict:",predict)
ax = plt.figure().add_subplot(111, projection = '3d')
ax.scatter(x_data[:,0], x_data[:,1], y_data, c = 'r', marker = 'o', s = 100)
#点为红色圆形
x0 = x_data[:,0]
x1 = x_data[:,1]
# 生成网格矩阵
x0, x1 = np.meshgrid(x0, x1)
z = model.intercept_ + x0*model.coef_[0] + x1*model.coef_[1]
# 画3D图
ax.plot_surface(x0, x1, z)
#设置坐标轴
ax.set_xlabel('Miles')
ax.set_ylabel('Num of Deliveries')
ax.set_zlabel('Time')

#显示图像
plt.show()
import numpy as np
import matplotlib.pyplot as plt
from sklearn.preprocessing import PolynomialFeatures
from sklearn.linear_model import LinearRegression
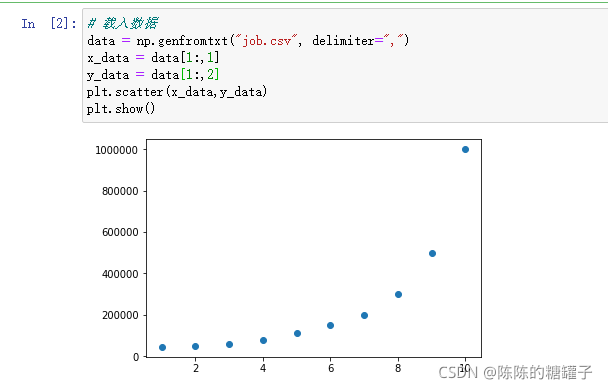
# 载入数据
data = np.genfromtxt("job.csv", delimiter=",")
x_data = data[1:,1]
y_data = data[1:,2]
plt.scatter(x_data,y_data)
plt.show()
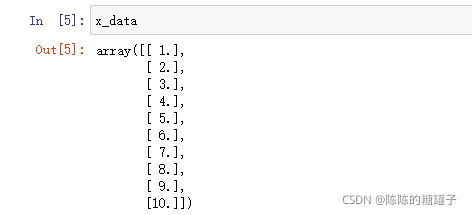
x_data
#增加维数
x_data = x_data[:,np.newaxis]
y_data = y_data[:,np.newaxis]
x_data
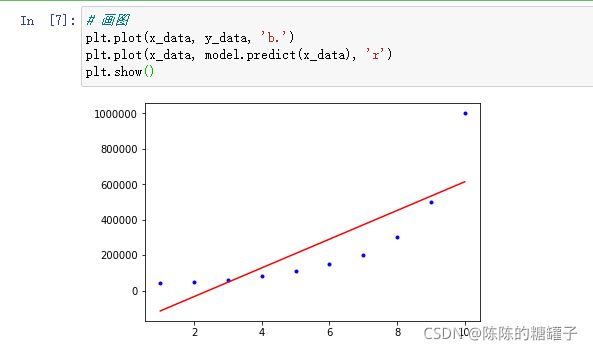
# 画图
plt.plot(x_data, y_data, 'b.')
plt.plot(x_data, model.predict(x_data), 'r')
plt.show()
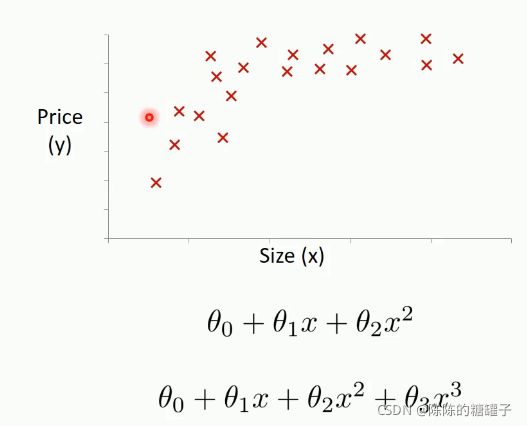
# 定义多项式回归,degree的值可以调节多项式的特征
poly_reg  = PolynomialFeatures(degree=5)
# 特征处理
x_poly = poly_reg.fit_transform(x_data)
# 定义回归模型
lin_reg = LinearRegression()
# 训练模型
lin_reg.fit(x_poly, y_data)

这里的degree是什么意思呢?


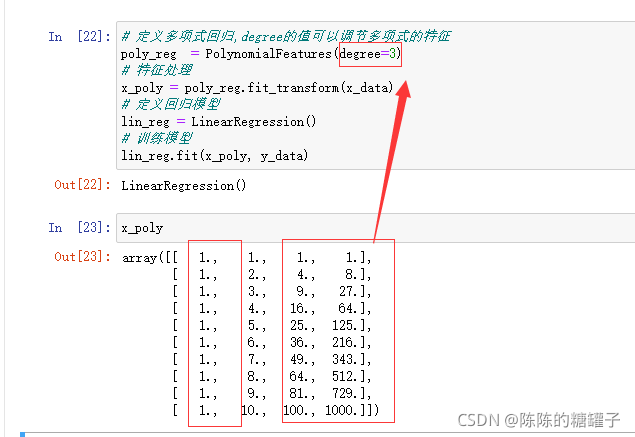
degree的意思其实就是要建立几次多项式拟合
# 画图
plt.plot(x_data, y_data, 'b.')
plt.plot(x_data, lin_reg.predict(poly_reg.fit_transform(x_data)), c='r')
#因为训练数据是经过特征处理的数据,所以这里做预测的时候传入的也是经过特征处理的数据
plt.title('Truth or Bluff (Polynomial Regression)')
plt.xlabel('Position level')
plt.ylabel('Salary')
plt.show()

我们会发现上面的曲线不够平滑,这是因为仅取了10个点,我们取数多一点的时候就会正常
# 画图
plt.plot(x_data, y_data, 'b.')
x_test = np.linspace(1,10,100)#从1开始到10结束,均匀生成100个点(等差数值)
x_test = x_test[:,np.newaxis]#增加维度
plt.plot(x_test, lin_reg.predict(poly_reg.fit_transform(x_test)), c='r')
plt.title('Truth or Bluff (Polynomial Regression)')
plt.xlabel('Position level')
plt.ylabel('Salary')
plt.show()

