❤echarts折线图完整使用及详细配置参数
❤echarts折线图完整使用及详细配置参数
进入echarts官网 查看案例,下面说说一些echarts图的调节
一、配置echarts具体参数
01 基础版本的折线图
option = {
  xAxis: {
    type: 'category',
    data: ['Mon', 'Tue', 'Wed', 'Thu', 'Fri', 'Sat', 'Sun']
  },
  yAxis: {
    type: 'value'
  },
  series: [
    {
      data: [150, 230, 224, 218, 135, 147, 260],
      type: 'line'
    }
  ]
};
【1】当echarts折线图x轴数据过多的时候如何处理呢
dataZoom 拖动滑动x轴,为我们提供了巨大的帮助,层级与xAxis平级。
  dataZoom: [{
      type: 'inside', //1平移 缩放
      throttle: '50', //设置触发视图刷新的频率。单位为毫秒(ms)。
      minValueSpan: 6, //用于限制窗口大小的最小值,在类目轴上可以设置为 5 表示 5 个类目
      start: 1, //数据窗口范围的起始百分比 范围是:0 ~ 100。表示 0% ~ 100%。
      end: 50, //数据窗口范围的结束百分比。范围是:0 ~ 100。
      zoomLock: true, //如果设置为 true 则锁定选择区域的大小,也就是说,只能平移,不能缩放。
    }],
【2】想要让折线图平滑
smooth 决定了线段的类型,直线或者曲线,层级与series下的data平级
smooth: true,// true为平滑线段 false为折线,默认为false
【3】想让你的echarts折线图变成面积图?
areaStyle: {} 决定了你的图形是否是面积图 ,层级与series下的data平级
areaStyle: {}
【4】y轴顶部标题
title 可以帮助我们实现 echarts y轴顶部的标题,层级与xAxis平级
title: { text: 'Stacked Line' },
【5】更改鼠标移动上去的效果
tooltip 可以帮助我们实现 echarts 鼠标悬浮上去的效果,层级与xAxis平级
tooltip: { trigger: 'axis'},
【6】调整折线图的边距和位置
grid 可以帮助我们实现 echarts 鼠标悬浮上去的效果,层级与xAxis平级
   grid: {
    left: '5%', //距离左侧边距
    right: '4%',
    bottom: '3%',
    containLabel: true
  },
当然gaid还有另外一种写法,哪种需要就用哪种
  grid: {
    x: "10%", //x 偏移量
    y: "7%", // y 偏移量
    width: "85%", // 宽度
    height: "55%", // 高度
    right: "15%",
  },
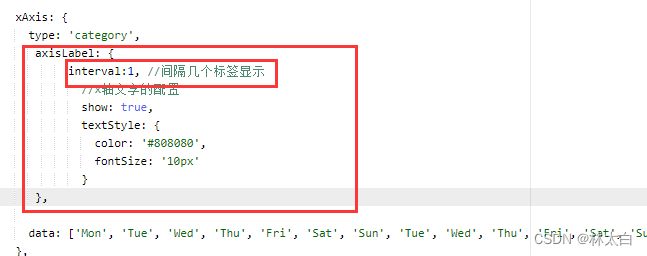
【7】 x轴设置间隔个数显示
axisLabel:{ interval:间隔数量 }
二、效果源码
以下折线图直接复制到echarts官网可以直接使用:
【折线图效果1】
【折线图源码1】
option = {
  title: {
    text: 'Stacked Line'
  },
  tooltip: {
    trigger: 'axis'
  },
  legend: {
    data: ['Email', 'Union Ads', 'Video Ads', 'Direct', 'Search Engine']
  },
  grid: {
    left: '3%',
    right: '4%',
    bottom: '3%',
    containLabel: true
  },
  toolbox: {
    feature: {
      saveAsImage: {}
    }
  },
  xAxis: {
    type: 'category',
    boundaryGap: false,
    data: ['Mon', 'Tue', 'Wed', 'Thu', 'Fri', 'Sat', 'Sun']
  },
  yAxis: {
    type: 'value'
  },
  series: [
    {
      name: 'Email',
      type: 'line',
      stack: 'Total',
      data: [120, 132, 101, 134, 90, 230, 210]
    },
    {
      name: 'Union Ads',
      type: 'line',
      stack: 'Total',
      data: [220, 182, 191, 234, 290, 330, 310]
    },
    {
      name: 'Video Ads',
      type: 'line',
      stack: 'Total',
      data: [150, 232, 201, 154, 190, 330, 410]
    },
    {
      name: 'Direct',
      type: 'line',
      stack: 'Total',
      data: [320, 332, 301, 334, 390, 330, 320]
    },
    {
      name: 'Search Engine',
      type: 'line',
      stack: 'Total',
      data: [820, 932, 901, 934, 1290, 1330, 1320]
    }
  ]
};
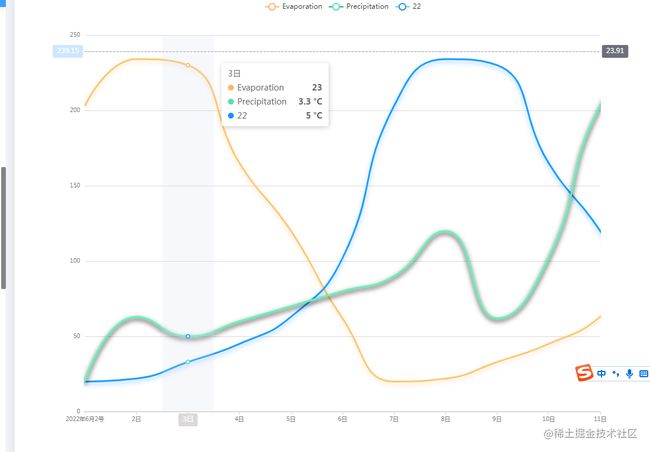
【折线图效果2】
【折线图源码2】
option = {
        color: ['#1890FF', '#52E3A9'], //'#FFB566',
        tooltip: {
          trigger: 'axis',
          axisPointer: {
            type: 'cross',
            crossStyle: {
              color: '#999'
            }
          }
        },
        splitLine: {
          color: '#85C2FC'
        },
        legend: {
          data: ['Evaporation', 'Precipitation', '22']
        },
        xAxis: [{
          boundaryGap: false, //过长隐藏x轴文字
          splitLine: {
            show: false,
            lineStyle: {
              color: ['rgba(133, 194, 252, 0.4)'],
              width: 1,
              type: 'solid'
            }
          },
          axisLine: {
            lineStyle: {
              type: 'solid',
              // color: 'rgba(133, 194, 252, 0.4)', //坐标线的颜色
              color:'#DBD8D9',
              width: '2' //坐标线的宽度
            }
          },
          axisLabel: {
            //x轴文字的配置
            show: true,
            textStyle: {
              color: '#808080',
              fontSize: '10px'
            }
          },
          type: 'category',
          data: [
            '2022年6月2号',
            '2日',
            '3日',
            '4日',
            '5日',
            '6日',
            '7日',
            '8日',
            '9日',
            '10日',
            '11日'
          ],
          axisPointer: {
            type: 'shadow'
          }
        }],
        yAxis: [{
            type: 'value',
            name: '',
            min: 0,
            max: 250,
            interval: 50,
            axisLabel: {
              //y轴文字的配置
              formatter: '{value}',
              show: true,
              textStyle: {

                color: '#808080',
                fontSize: '10px'
              }
              // formatter: '{value} %'//y轴的每一个刻度值后面加上‘%’号
            },
            axisLine: {
              lineStyle: {
                type: 'solid',
                color: 'rgba(133, 194, 252, 0.4)', //坐标线的颜色
                width: '2' //坐标线的宽度
              }
            },
            splitLine: {
              show: true,
              lineStyle: {
                // color: ['rgba(133, 194, 252, 0.4)'],
                color:'#DBD8D9',
                width: 1,
                type: 'solid'
              }
            },
          },
          {
            type: 'value',
            name: '',
            show: false,
            min: 0,
            max: 25,
            interval: 5,
            axisLabel: {
              formatter: '{value}'
            }
          }
        ],
        series: [
          {
            name: 'Evaporation',
            type: 'line',
            smooth: true, //平滑
            showSymbol: false,
            lineStyle: {
              // 阴影部分
              width: 3, // 线条颜色、粗细
              color: '#FFB566',
              shadowOffsetX: 0, // 折线的X偏移
              shadowOffsetY: 4, // 折线的Y偏移
              shadowBlur: 8, // 折线模糊
              shadowColor: 'rgba(255, 181, 102, 0.4)' //折线颜色
            },
            color: '#FFB566',
            yAxisIndex: 1,
            tooltip: {
              valueFormatter: function(value) {
                return value;
              }
            },
            data: [20.3, 23.4, 23.0, 16.5, 12.0, 6.2, 2.0, 2.2, 3.3, 4.5, 6.3, 10.2]
          },
          {
            name: 'Precipitation',
            type: 'line',
            smooth: true, //平滑
            lineStyle: {
              // 阴影部分
              width: 3, // 线条颜色、粗细
              color: '#1791FF',
              shadowOffsetX: 0, // 折线的X偏移
              shadowOffsetY: 4, // 折线的Y偏移
              shadowBlur: 8, // 折线模糊
              shadowColor: 'rgba(3,116,255,0.4)' //折线颜色
            },
            showSymbol: false,

            color: '#52E3A9',
            yAxisIndex: 1,
            tooltip: {
              valueFormatter: function(value) {
                return value + ' °C';
              }
            },
            data: [2.0, 2.2, 3.3, 4.5, 6.3, 10.2, 20.3, 23.4, 23.0, 16.5, 12.0, 6.2]
          },
          {
            name: '22',
            type: 'line',
            showSymbol: false,
            lineStyle: {
              // 阴影部分
              width: 3, // 线条颜色、粗细
              color: '#52E3A9',
              shadowOffsetX: 0, // 折线的X偏移
              shadowOffsetY: 4, // 折线的Y偏移
              shadowBlur: 8, // 折线模糊
              shadowColor: 'rgba(3,116,255,0.4);' //折线颜色
            },
            smooth: true,
            color: '#1890FF',
            yAxisIndex: 1,
            tooltip: {
              valueFormatter: function(value) {
                return value + ' °C';
              }
            },
            data: [2, 6.3, 5.0, 6, 7, 8, 9, 12.0, 6.2, 10.2, 20.3, 23.4]
          }
        ]
      };
三、完整使用案例
import * as echarts from 'echarts';

var chartDom = document.getElementById('main');
var myChart = echarts.init(chartDom);
var option;
 myChart.setOption(
 {
  tooltip: {
    trigger: ''
  },
  // legend: {
  //   data: ['Email', 'Union Ads']
  // },
  grid: { //距离各个地方的边距 1
    left: '10%',
    right: '5%',
    bottom: '10%',
    containLabel: true
  },
grid: {  //另外一种方式控制 2
        x: "12%",//x 偏移量
        y: "7%", // y 偏移量
        width: "87%", // 宽度
        height: "79%"// 高度
 },
  xAxis: {
    type: 'category',
    boundaryGap: false,
    data: ['Mon', 'Tue', 'Wed', 'Thu', 'Fri', 'Sat', 'Sun']
  },
  yAxis: {
    type: 'value',,
    // 隐藏y轴
        axisLine: {
          show: false
        },
   // 隐藏y轴刻度线
        axisTick: {
          show: false
        },
        // y轴网格线设置
        splitLine: {
          type: "dashed",
          color: "#eeeeee"
        },
  },
  series: [
    {
      name: 'Email',
      type: 'line',
      stack: 'Total',
      data: [120, 132, 101, 134, 90, 230, 210]
    },
    {
      name: 'Union Ads',
      type: 'line',
      stack: 'Total',
      data: [220, 182, 191, 234, 290, 330, 310]
    }
  ]
 });


