实现人物关系图还在用Echarts吗?快试试relation-graph
关于relation-graph
支持Vue和React的 关联关系图谱组件,可以展示如组织机构图谱、股权架构图谱、集团关系图谱等知识图谱,可提供多种图谱布局,包括树状布局、中心布局、力学布局自动布局等。官网
安装使用
一,通过nodejs开发vue的使用者
1, 引入relation-graph
// 注意:relation-graph支持Vue2、Vue3、React, 但引入的包名称都是【relation-graph】
npm install --save relation-graph
2, 示例代码:
通过调整以下示例代码中的options、nodes、lines的配置实现不同的展示效果,还可以通过事件在图谱中实现交互式功能,更多的示例
2.1.2 Vue2:
<template>
   <div>
     <div style="height:calc(100vh - 50px);">
        <RelationGraph ref="seeksRelationGraph" :options="graphOptions" :on-node-click="onNodeClick" :on-line-click="onLineClick" />
     </div>
   </div>
 </template>

 <script>
// relation-graph也支持在main.js文件中使用Vue.use(RelationGraph);这样,你就不需要下面这一行代码来引入了。
 import RelationGraph from 'relation-graph'
 export default {
   name: 'Demo',
   components: { RelationGraph },
   data() {
     return {
       graphOptions: {
         allowSwitchLineShape: true,
         allowSwitchJunctionPoint: true,
         defaultJunctionPoint: 'border'
         // 这里可以参考"Graph 图谱"中的参数进行设置
       }
     }
   },
   mounted() {
     this.showSeeksGraph()
   },
   methods: {
     showSeeksGraph() {
       const __graph_json_data = {
         rootId: 'a',
         nodes: [
           { id: 'a', text: 'A', borderColor: 'yellow' },
           { id: 'b', text: 'B', color: '#43a2f1', fontColor: 'yellow' },
           { id: 'c', text: 'C', nodeShape: 1, width: 80, height: 60 },
           { id: 'e', text: 'E', nodeShape: 0, width: 150, height: 150 }
         ],
         lines: [
           { from: 'a', to: 'b', text: '关系1', color: '#43a2f1' },
           { from: 'a', to: 'c', text: '关系2' },
           { from: 'a', to: 'e', text: '关系3' },
           { from: 'b', to: 'e', color: '#67C23A' }
         ]
       }
       // 以上数据中的node和link可以参考"Node节点"和"Link关系"中的参数进行配置
       this.$refs.seeksRelationGraph.setJsonData(__graph_json_data, (seeksRGGraph) => {
         // Called when the relation-graph is completed
       })
     },
     onNodeClick(nodeObject, $event) {
       console.log('onNodeClick:', nodeObject)
     },
     onLineClick(lineObject, $event) {
       console.log('onLineClick:', lineObject)
     }
   }
 }
 </script>
VUE3
<template>
  <div>
    <div style="border: #efefef solid 1px; height: calc(100vh - 100px);width: 100%;">
      <relation-graph ref="relationGraph$" :options="options" />
    </div>
  </div>
</template>

<script setup lang="ts">
import { onMounted, ref } from 'vue'
import RelationGraph from 'relation-graph/vue3'
const relationGraph$ = ref<RelationGraph>()
const options = {
  defaultExpandHolderPosition: 'right'
}
onMounted(() => {
  const jsonData = {
    rootId: 'a',
    nodes: [
      { id: 'a', text: 'a', },
      { id: 'b', text: 'b', },
      { id: 'c', text: 'c', },
      { id: 'd', text: 'd', },
      { id: 'e', text: 'e', },
      { id: 'f', text: 'f', },
    ],
    lines: [
      { from: 'a', to: 'b', },
      { from: 'a', to: 'c', },
      { from: 'a', to: 'd', },
      { from: 'a', to: 'e', },
      { from: 'a', to: 'f', },
    ],
  }
  relationGraph$.value.setJsonData(jsonData)
})
</script>
二,通过CDN方式使用
2.1.2 使用Vue2:
建议使用 CDN 引入的用户在链接地址上锁定版本,以免将来升级时受到非兼容性更新的影响。锁定版本的方法请查看 unpkg.com。
2.1.3 使用Vue3:
建议使用 CDN 引入的用户在链接地址上锁定版本,以免将来升级时受到非兼容性更新的影响。锁定版本的方法请查看 unpkg.com。
效果图
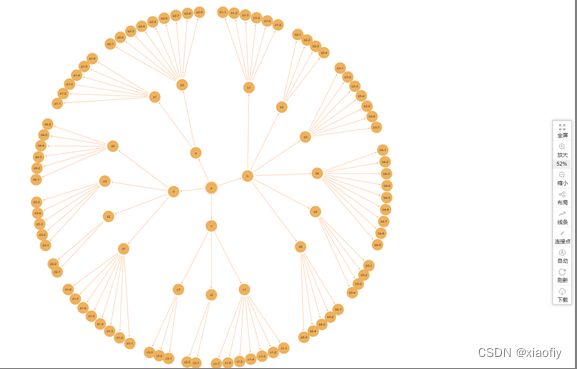

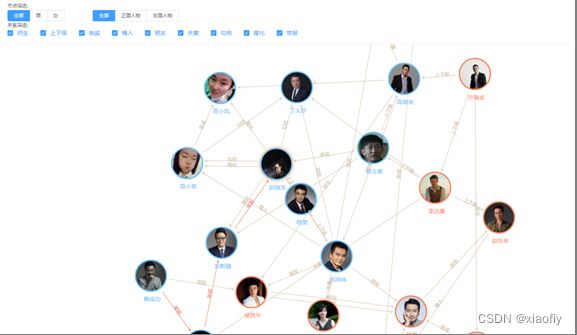
总结
本文只是简单的讲述了relation-graph的使用安装,relation-graph使用支持Vue和React的 关联关系图谱组件,可以展示如组织机构图谱、股权架构图谱、集团关系图谱等知识图谱,可提供多种图谱布局,包括树状布局、中心布局、力学布局自动布局等