Python_画boxplot 盒图/箱线图
Python_画boxplot 盒图/箱线图
- Boxplot图的介绍
- API介绍
- 示例Demo
-
- Demo 1: 绘制简单的Boxplot
- Demo 2:复杂的Boxplot, 为每个boxplot指定不同的颜色
- References
Boxplot图的介绍
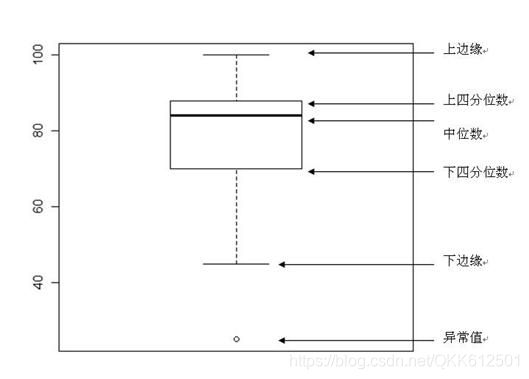
箱形图(Box-plot)又称为盒须图/盒式图/箱线图,是一种用作显示一组数据分散情况的统计图。这自然让人想到分位数的概念, 不错, boxplot就是通过分位数来直观展示数据的分散程度。

如上图,几个重要的参数:
下边缘(Q1),表示最小值;
下四分位数(Q2),又称“第一四分位数”,等于该样本中所有数值由小到大排列后第25%的数字;
中位数(Q3),又称“第二四分位数”等于该样本中所有数值由小到大排列后第50%的数字;
上四分位数(Q4),又称“第三四分位数”等于该样本中所有数值由小到大排列后第75%的数字;
上边缘(Q5),表述最大值。
极端异常值,即超出四分位数差3倍距离的异常值,用实心点表示;较为温和的异常值,即处于1.5倍-3倍四分位数差之间的异常值,用空心点表示
API介绍

参数:
x: Array 或者向量序列, Array的话每一行对应一个box, 序列list的话每个子list对应一个box;
labels: 每个box的label, 与x对应
patch_artist: 是否填充box
vert: 控制图的呈现方向 (水平或者垂直)
widths: 指定每个box的宽度
示例Demo
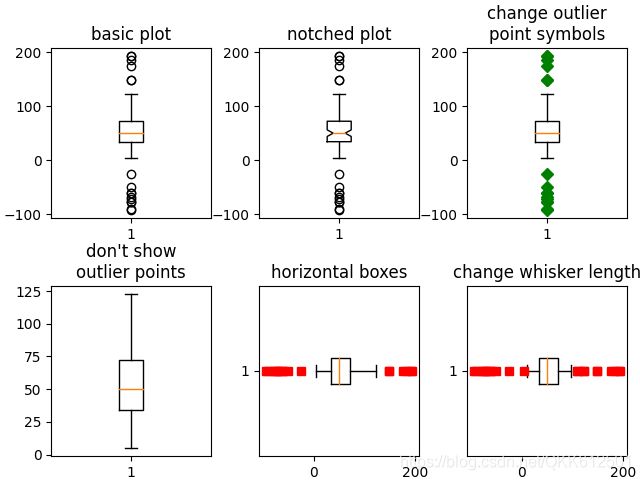
Demo 1: 绘制简单的Boxplot
import matplotlib.pyplot as plt
import numpy as np
from matplotlib.patches import Polygon


# Fixing random state for reproducibility
np.random.seed(19680801)

# fake up some data
spread = np.random.rand(50) * 100
center = np.ones(25) * 50
flier_high = np.random.rand(10) * 100 + 100
flier_low = np.random.rand(10) * -100
data = np.concatenate((spread, center, flier_high, flier_low))

fig, axs = plt.subplots(2, 3)

# basic plot
axs[0, 0].boxplot(data)
axs[0, 0].set_title('basic plot')

# notched plot
axs[0, 1].boxplot(data, 1)
axs[0, 1].set_title('notched plot')

# change outlier point symbols
axs[0, 2].boxplot(data, 0, 'gD')
axs[0, 2].set_title('change outlier\npoint symbols')

# don't show outlier points
axs[1, 0].boxplot(data, 0, '')
axs[1, 0].set_title("don't show\noutlier points")

# horizontal boxes
axs[1, 1].boxplot(data, 0, 'rs', 0)
axs[1, 1].set_title('horizontal boxes')

# change whisker length
axs[1, 2].boxplot(data, 0, 'rs', 0, 0.75)
axs[1, 2].set_title('change whisker length')

fig.subplots_adjust(left=0.08, right=0.98, bottom=0.05, top=0.9,
                    hspace=0.4, wspace=0.3)

# fake up some more data
spread = np.random.rand(50) * 100
center = np.ones(25) * 40
flier_high = np.random.rand(10) * 100 + 100
flier_low = np.random.rand(10) * -100
d2 = np.concatenate((spread, center, flier_high, flier_low))
# Making a 2-D array only works if all the columns are the
# same length.  If they are not, then use a list instead.
# This is actually more efficient because boxplot converts
# a 2-D array into a list of vectors internally anyway.
data = [data, d2, d2[::2]]

# Multiple box plots on one Axes
fig, ax = plt.subplots()
ax.boxplot(data)

plt.show()
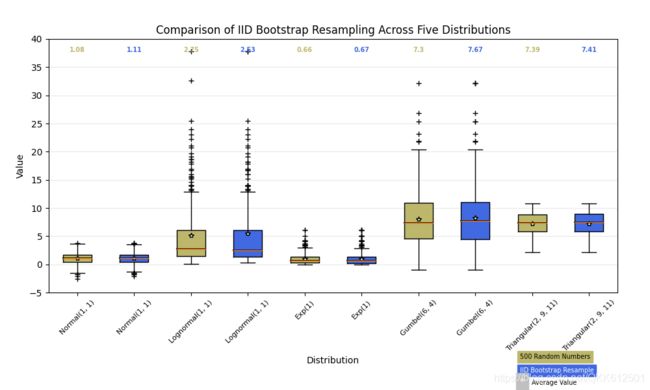
Demo 2:复杂的Boxplot, 为每个boxplot指定不同的颜色
一些小技巧:
(1)x_tick的斜体显示
主要是通过ax.text方法的transform参数来指定的:
ax.text(pos[tick], .95, upper_labels[tick],transform=ax.get_xaxis_transform(),
其中ax:
ax.set_xticklabels(np.repeat(random_dists, 2),
rotation=45, fontsize=8)
可以看到旋转角度为45度。
(2)不同的boxplot显示不同的颜色
random_dists = ['Normal(1, 1)', 'Lognormal(1, 1)', 'Exp(1)', 'Gumbel(6, 4)',
                'Triangular(2, 9, 11)']
N = 500

norm = np.random.normal(1, 1, N)
logn = np.random.lognormal(1, 1, N)
expo = np.random.exponential(1, N)
gumb = np.random.gumbel(6, 4, N)
tria = np.random.triangular(2, 9, 11, N)

# Generate some random indices that we'll use to resample the original data
# arrays. For code brevity, just use the same random indices for each array
bootstrap_indices = np.random.randint(0, N, N)
data = [
    norm, norm[bootstrap_indices],
    logn, logn[bootstrap_indices],
    expo, expo[bootstrap_indices],
    gumb, gumb[bootstrap_indices],
    tria, tria[bootstrap_indices],
]

fig, ax1 = plt.subplots(figsize=(10, 6))
fig.canvas.manager.set_window_title('A Boxplot Example')
fig.subplots_adjust(left=0.075, right=0.95, top=0.9, bottom=0.25)

bp = ax1.boxplot(data, notch=0, sym='+', vert=1, whis=1.5)
plt.setp(bp['boxes'], color='black')
plt.setp(bp['whiskers'], color='black')
plt.setp(bp['fliers'], color='red', marker='+')

# Add a horizontal grid to the plot, but make it very light in color
# so we can use it for reading data values but not be distracting
ax1.yaxis.grid(True, linestyle='-', which='major', color='lightgrey',
               alpha=0.5)

ax1.set(
    axisbelow=True,  # Hide the grid behind plot objects
    title='Comparison of IID Bootstrap Resampling Across Five Distributions',
    xlabel='Distribution',
    ylabel='Value',
)

# Now fill the boxes with desired colors
box_colors = ['darkkhaki', 'royalblue']
num_boxes = len(data)
medians = np.empty(num_boxes)
for i in range(num_boxes):
    box = bp['boxes'][i]
    box_x = []
    box_y = []
    for j in range(5):
        box_x.append(box.get_xdata()[j])
        box_y.append(box.get_ydata()[j])
    box_coords = np.column_stack([box_x, box_y])
    # Alternate between Dark Khaki and Royal Blue
    ax1.add_patch(Polygon(box_coords, facecolor=box_colors[i % 2]))
    # Now draw the median lines back over what we just filled in
    med = bp['medians'][i]
    median_x = []
    median_y = []
    for j in range(2):
        median_x.append(med.get_xdata()[j])
        median_y.append(med.get_ydata()[j])
        ax1.plot(median_x, median_y, 'k')
    medians[i] = median_y[0]
    # Finally, overplot the sample averages, with horizontal alignment
    # in the center of each box
    ax1.plot(np.average(med.get_xdata()), np.average(data[i]),
             color='w', marker='*', markeredgecolor='k')

# Set the axes ranges and axes labels
ax1.set_xlim(0.5, num_boxes + 0.5)
top = 40
bottom = -5
ax1.set_ylim(bottom, top)
ax1.set_xticklabels(np.repeat(random_dists, 2),
                    rotation=45, fontsize=8)

# Due to the Y-axis scale being different across samples, it can be
# hard to compare differences in medians across the samples. Add upper
# X-axis tick labels with the sample medians to aid in comparison
# (just use two decimal places of precision)
pos = np.arange(num_boxes) + 1
upper_labels = [str(round(s, 2)) for s in medians]
weights = ['bold', 'semibold']
for tick, label in zip(range(num_boxes), ax1.get_xticklabels()):
    k = tick % 2
    ax1.text(pos[tick], .95, upper_labels[tick],
             transform=ax1.get_xaxis_transform(),
             horizontalalignment='center', size='x-small',
             weight=weights[k], color=box_colors[k])

# Finally, add a basic legend
fig.text(0.80, 0.08, f'{N} Random Numbers',
         backgroundcolor=box_colors[0], color='black', weight='roman',
         size='x-small')
fig.text(0.80, 0.045, 'IID Bootstrap Resample',
         backgroundcolor=box_colors[1],
         color='white', weight='roman', size='x-small')
fig.text(0.80, 0.015, '*', color='white', backgroundcolor='silver',
         weight='roman', size='medium')
fig.text(0.815, 0.013, ' Average Value', color='black', weight='roman',
         size='x-small')

plt.show()
References
1.https://matplotlib.org/stable/gallery/statistics/boxplot_demo.html#sphx-glr-gallery-statistics-boxplot-demo-py

