一:柱形图
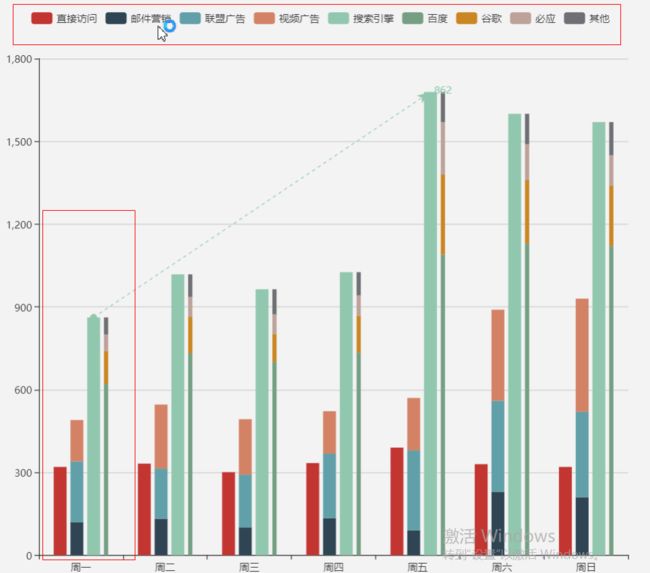
1.Echarts-柱状图柱图宽度设置-----只需要设置series中的坐标系属性barWidth就可以
/**
 * 堆积柱状图
 * @param xaxisdata x轴:标签(数组)
 * @param serieszs 柱状图图数据(数组)
 * @param seriesyx 柱状图图数据(数组)
 */
function drawDJZZT(xaxisdata,serieszs,seriesyx){
    var myChart = echarts.init(document.getElementById('main1'));
    myChart.setOption({
        title : {
            text : ""
        },
        tooltip : {
            trigger : 'axis',
            showDelay : 0, // 显示延迟,添加显示延迟可以避免频繁切换,单位ms
            axisPointer : {            // 坐标轴指示器,坐标轴触发有效
                type : 'shadow'        // 默认为直线,可选为:'line' | 'shadow'
            }
        },
        legend: {
            data:['做市', '协议'] }, xAxis : [{ type : 'category', data : xaxisdata, axisLabel:{ textStyle:{ color:"#222" } } }], yAxis : [{ type : 'value' }], series : [ { name:'做市', type:'bar', stack: '总量', /*itemStyle : { normal: {label : {show: true, position: 'insideTop',textStyle:{color:'#000'}}}},*/ data:serieszs }, { name:'协议', type:'bar', stack: '总量', barWidth : 30,//柱图宽度 /*itemStyle : { normal: {label : {show: true, position: 'insideTop',textStyle:{color:'#000'}}}},*/ data:seriesyx } ] }); }

2.echarts 取消图例上的点击事件和图表上鼠标滑过点击事件
//取消 鼠标滑过的提示框
tooltip : {
        trigger: 'item',
        show:false,
        formatter: "{a}
{b} : {c} ({d}%)"
    },
//取消图例的点击事件
  legend: {
        orient : 'vertical',  selectedMode:false, x : 'left', data:['直接访问','邮件营销','联盟广告','视频广告','搜索引擎'] }, //取消图表上的点击事件  series : [ { name:'访问来源', type:'pie', clickable:false, radius : '55%', center: ['50%', '60%'], data:[ {value:335, name:'直接访问'}, {value:310, name:'邮件营销'}, {value:234, name:'联盟广告'}, {value:135, name:'视频广告'}, {value:1548, name:'搜索引擎'} ] } ]

3.echarts去掉横纵坐标的刻度值
   xAxis: [
                        {
                            type: 'value',
                            scale: true,
                            splitLine: {
                                show: false
                            },
                            axisTick: {
                                show: false
                            },
                            axisLabel: {
                                show: false
                            }
                        }
                    ],
                    yAxis: [
                        {
                            type: 'value',
                            scale: true,
                            splitLine: {
                                show:false
                            },
                            axisTick: {
                                show: false
                            },
                            axisLabel: {
                                show: false
                            }
                        }
                    ],

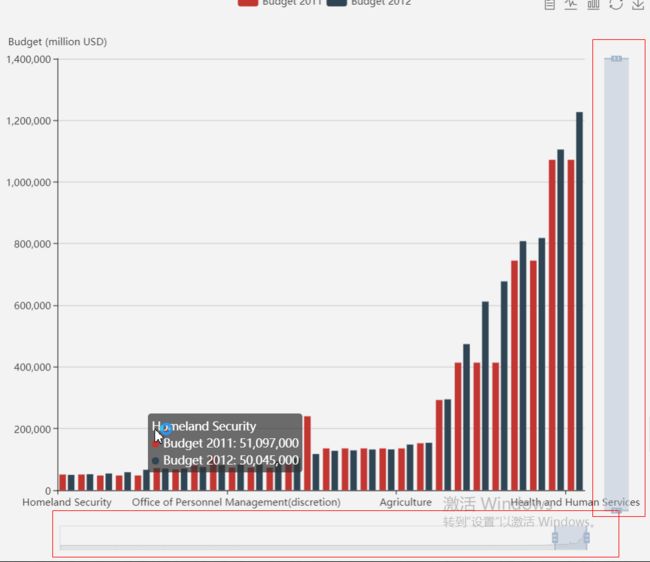
4.echarts去掉纵向或者横向缩放

dataZoom: [
                    {
                        type: 'slider',
                        show: true,
                        showDetail: false,
                        xAxisIndex: [0],//只显示x轴的缩放
                        start: 1,//从最左边0开始
                        end: len <= 10 ? 100 : (10 / len * 100),//一直到最后结束
                        backgroundColor: 'rgba(248,252,254,0.5)',
                        dataBackground: {
                            areaStyle: {
                                color: 'rgba(58,170,239,0.9)',
                                shadowBlur: 'rgba(58,170,239,0.9)',
                                shadowColor: 'rgba(58,170,239,0.9)',
                                shadowOffsetX: 0,
                                shadowOffsetY: 0,
                                opacity: 0.3,
                            }
                        }
                    }
                ]


