一、ceres学习——初识ceres
前述
假设已经知晓这样一个数学模型
y = f ( x ) = A e x + B s i n ( x ) + C x 2 y=f(x)=Ae^x+Bsin(x)+Cx^2 y=f(x)=Aex+Bsin(x)+Cx2
但是不知道具体的系数 A A A、 B B B和 C C C,需要通过实验获取数据进行拟合,但是不巧的是实验数据里面有噪声,也就是
y ^ = A e x + B s i n ( x ) + C x 2 + v \hat{y}=Ae^x+Bsin(x)+Cx^2+v y^=Aex+Bsin(x)+Cx2+v
ceres可以完成这样一件事。
第一个ceres程序
这部分包含主程序代码和CMakeists.txt文件代码
主程序
#include
#include
#include "glog/logging.h"
#include
#include
#include"matplotlibcpp.h"
double function(double x){
    return 0.02*exp(x)+3.2*sin(x)+1.1*x*x;
}
std::vector> measurement_data_generation(double begin,double end,double stride,double (*fun)(double)){
    std::vector> out;
    std::mt19937 mt;
    mt.seed(std::chrono::system_clock::now().time_since_epoch().count());
    for(double i=begin;i(0,20)(mt);
        y_=y_+fun(i);
        out.push_back(std::make_pair(i,y_));
    }
    return out;
}
//y=A*exp(x)+B*sinx+C*x^2,A=0.02,B=3.2,C=1.1
struct ceres_tutorial{
public:
    ceres_tutorial(double x,double y):x_(x),y_(y){}
    template
    bool operator()(const T* const A,const T* const B,const T* const C,T* residual)const{
        residual[0]=y_-A[0]*exp(x_)-B[0]*sin(x_)-C[0]*x_*x_;
        return true;
    }
private:
    double x_;
    double y_;
};
int main(int argc,char** argv){

    google::InitGoogleLogging(argv[0]);
    ceres::Problem problem;

    double A{0.};
    double B{0.};
    double C{0.};

    double begin{1.},end{10.},stride{0.05};
    std::vector> data=measurement_data_generation(begin,end,stride,function);

    for(auto data_:data){
        ceres::CostFunction *cost_function=new ceres::AutoDiffCostFunction(new ceres_tutorial(data_.first,data_.second));
        problem.AddResidualBlock(cost_function,nullptr,&A,&B,&C);
    }

    ceres::Solver::Options options;
    options.minimizer_progress_to_stdout=true;
    ceres::Solver::Summary summary;
    ceres::Solve(options, &problem, &summary);

    std::cout<
主程序使用
安装matplotlibcpp和ceres。
主程序解释
包含三个部分:仿真数据生成、ceres求解、结果可视化。
仿真数据生成
double function(double x){
    return 0.02*exp(x)+3.2*sin(x)+1.1*x*x;
}
std::vector> measurement_data_generation(double begin,double end,double stride,double (*fun)(double)){
    std::vector> out;
    std::mt19937 mt;
    mt.seed(std::chrono::system_clock::now().time_since_epoch().count());
    for(double i=begin;i(0,20)(mt);
        y_=y_+fun(i);
        out.push_back(std::make_pair(i,y_));
    }
    return out;
}
ceres求解
struct ceres_tutorial{
public:
    ceres_tutorial(double x,double y):x_(x),y_(y){}
    template
    bool operator()(const T* const A,const T* const B,const T* const C,T* residual)const{
        residual[0]=y_-A[0]*exp(x_)-B[0]*sin(x_)-C[0]*x_*x_;
        return true;
    }
private:
    double x_;
    double y_;
};

...
int main(int argc,char** argv){
...
for(auto data_:data){
        ceres::CostFunction *cost_function=new ceres::AutoDiffCostFunction(new ceres_tutorial(data_.first,data_.second));
        problem.AddResidualBlock(cost_function,nullptr,&A,&B,&C);
    }

    ceres::Solver::Options options;
    options.minimizer_progress_to_stdout=true;
    ceres::Solver::Summary summary;
    ceres::Solve(options, &problem, &summary);
...
}
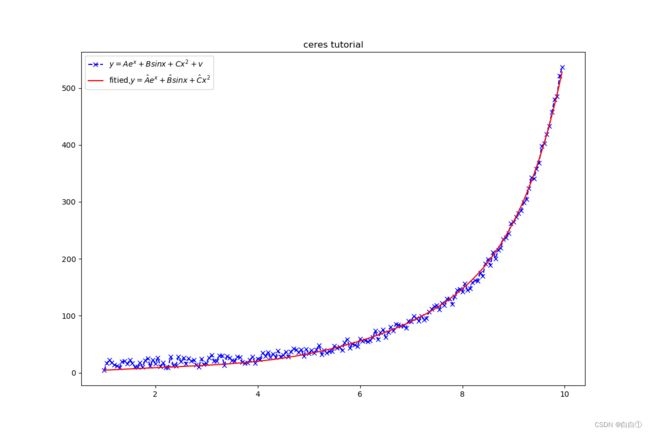
结果可视化
std::vector x,y,y_;
    for(auto data_:data){
        x.push_back(data_.first);
        y.push_back(data_.second);
        y_.push_back(A*exp(data_.first)+B*sin(data_.first)+C*data_.first*data_.first);
    }
    matplotlibcpp::figure_size(1200,800);
    matplotlibcpp::named_plot("$y=Ae^x+Bsinx+Cx^2+v$",x,y,"bx--");
    matplotlibcpp::named_plot("fitied,$y=\\hat{A}e^x+\\hat{B}sinx+\\hat{C}x^2$",x,y_,"r-");
    matplotlibcpp::legend();
    matplotlibcpp::title("ceres tutorial");
    matplotlibcpp::show();
CMakeLists.txt
cmake_minimum_required(VERSION 2.8)
project(ceres-tutorial)
find_package(Ceres REQUIRED)
find_package(Python3 COMPONENTS Interpreter Development REQUIRED)
include_directories(${CERES_INCLUDE_DIRS})

file(GLOB SOURCE_FILE ${CMAKE_SOURCE_DIR}/*.cpp)
foreach(CPP IN LISTS SOURCE_FILE)
    get_filename_component(CPP_FILENAME ${CPP} NAME_WE)
    add_executable(${CPP_FILENAME} ${CPP})
    target_link_libraries(${CPP_FILENAME} ${CERES_LIBRARIES} Python3::Python Python3::Module)
endforeach(CPP IN LISTS SOURCE_FILE)
