一起来学shiny把(5)—反应式
什么是shiny?Shiny是一个R包,可让您轻松地直接从 R 构建交互式 Web 应用程序(应用程序)。本系列是个长教程,带你由浅入深学习shiny。

上一节我们在文章《R语言系列教程—–一起来学shiny吧(4)》中,介绍怎么在shiny中对控件进行输出,今天咱们来介绍一下反应式。
我们先看下面的图片

输入名字后可以得到Hello零基础说科研!具体设置看下面代码,在textInput中,我们定义了”name”这个变量,等于我们输入零基础说科研说科研这几个字就会用”name”来定义它,然后在前端定义了一个输出变量”greeting”。接下来就是后端进行数据处理了,renderText读入input$name这个变量,然后通过paste0函数整合成Hello 零基础说科研!,然后在output $ greeting这里对它进行定义。
library(shiny)
## Warning: 程辑包'shiny'是用R版本4.2.2 来建造的
ui <- fluidPage(
  textInput("name", "What's your name?"),
  textOutput("greeting")
)

server <- function(input, output, session) {
  output$greeting <- renderText({
    paste0("Hello ", input$name, "!")
  })
}

shinyApp(ui, server)
## PhantomJS not found. You can install it with webshot::install_phantomjs(). If it is installed, please make sure the phantomjs executable can be found via the PATH variable.

下面我们来讲一下反应式,什么是反应式?可以看做是一个连接前后的工具或者桥梁,我们看一下下面代码,实现的功能和前面一模一样,但是这回”greeting”和output $ greeting不是直接相连,中间多了一个string ,string 把”greeting”和output$greeting进行了关联。
ui <- fluidPage(
  textInput("name", "What's your name?"),
  textOutput("greeting")
)

server <- function(input, output, session) {
  output$greeting <- renderText(string())
  string <- reactive(paste0("Hello ", input$name, "!"))
}

shinyApp(ui, server)

用个思维导图来看就是

把顺序换一下也是可以的,但是我觉得还是尽量不要这样写
ui <- fluidPage(
  textInput("name", "What's your name?"),
  textOutput("greeting")
)

server <- function(input, output, session) {
  output$greeting <- renderText(string())
  string <- reactive(paste0("Hello ", input$name, "!"))
}

shinyApp(ui, server)

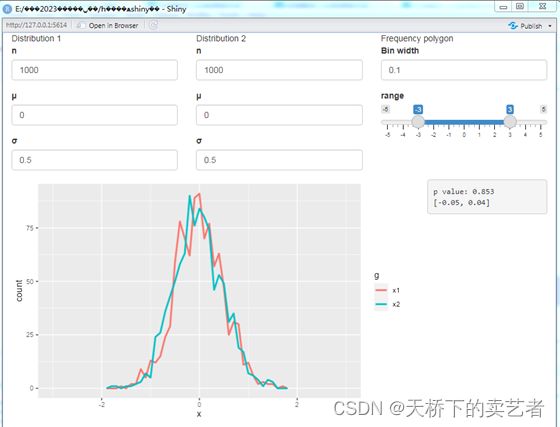
我们来看一个例子,column创建一列的对象,width是它要设置的宽度,范围是1-12,“Distribution 1”,每列有3个按键,“Distribution 2”也是一样,最后得出。
ui <- fluidPage(
  fluidRow(
    column(4,
      "Distribution 1",
      numericInput("n1", label = "n", value = 1000, min = 1),
      numericInput("mean1", label = "µ", value = 0, step = 0.1),
      numericInput("sd1", label = "σ", value = 0.5, min = 0.1, step = 0.1)
    ),
    column(4,
      "Distribution 2",
      numericInput("n2", label = "n", value = 1000, min = 1),
      numericInput("mean2", label = "µ", value = 0, step = 0.1),
      numericInput("sd2", label = "σ", value = 0.5, min = 0.1, step = 0.1)
    ),
    column(4,
      "Frequency polygon",
      numericInput("binwidth", label = "Bin width", value = 0.1, step = 0.1),
      sliderInput("range", label = "range", value = c(-3, 3), min = -5, max = 5)
    )
  ),
  fluidRow(
    column(9, plotOutput("hist")),
    column(3, verbatimTextOutput("ttest"))
  )
)

server <- function(input, output, session) {
  output$hist <- renderPlot({
    x1 <- rnorm(input$n1, input$mean1, input$sd1)
    x2 <- rnorm(input$n2, input$mean2, input$sd2)

    freqpoly(x1, x2, binwidth = input$binwidth, xlim = input$range)
  }, res = 96)

  output$ttest <- renderText({
    x1 <- rnorm(input$n1, input$mean1, input$sd1)
    x2 <- rnorm(input$n2, input$mean2, input$sd2)

    t_test(x1, x2)
  })
}

shinyApp(ui, server)

我们可以看到上面的例子比较复杂,关系看得也很混乱。我们可以使用反应式来改写它,server 这部分的内容中,x1和x2通过反应式生成.调用reactive()并将结果分配给变量.
ui <- fluidPage(
  fluidRow(
    column(4,
      "Distribution 1",
      numericInput("n1", label = "n", value = 1000, min = 1),
      numericInput("mean1", label = "µ", value = 0, step = 0.1),
      numericInput("sd1", label = "σ", value = 0.5, min = 0.1, step = 0.1)
    ),
    column(4,
      "Distribution 2",
      numericInput("n2", label = "n", value = 1000, min = 1),
      numericInput("mean2", label = "µ", value = 0, step = 0.1),
      numericInput("sd2", label = "σ", value = 0.5, min = 0.1, step = 0.1)
    ),
    column(4,
      "Frequency polygon",
      numericInput("binwidth", label = "Bin width", value = 0.1, step = 0.1),
      sliderInput("range", label = "range", value = c(-3, 3), min = -5, max = 5)
    )
  ),
  fluidRow(
    column(9, plotOutput("hist")),
    column(3, verbatimTextOutput("ttest"))
  )
)


server <- function(input, output, session) {
  x1 <- reactive(rnorm(input$n1, input$mean1, input$sd1))
  x2 <- reactive(rnorm(input$n2, input$mean2, input$sd2))

  output$hist <- renderPlot({
    freqpoly(x1(), x2(), binwidth = input$binwidth, xlim = input$range)
  }, res = 96)

  output$ttest <- renderText({
    t_test(x1(), x2())
  })
}

shinyApp(ui, server)

下面图表展示了关系,修改后的更加让人容易理解

我们把上面的模块简化一下
ui <- fluidPage(
  fluidRow(
    column(3,
      numericInput("lambda1", label = "lambda1", value = 3),
      numericInput("lambda2", label = "lambda2", value = 5),
      numericInput("n", label = "n", value = 1e4, min = 0)
    ),
    column(9, plotOutput("hist"))
  )
)
server <- function(input, output, session) {
  x1 <- reactive(rpois(input$n, input$lambda1))
  x2 <- reactive(rpois(input$n, input$lambda2))
  output$hist <- renderPlot({
    freqpoly(x1(), x2(), binwidth = 1, xlim = c(0, 40))
  }, res = 96)
}

shinyApp(ui, server)

加入一个定时器的反应式,得到的是一个动图,我这里网页显示出来不会动
ui <- fluidPage(
  fluidRow(
    column(3,
      numericInput("lambda1", label = "lambda1", value = 3),
      numericInput("lambda2", label = "lambda2", value = 5),
      numericInput("n", label = "n", value = 1e4, min = 0)
    ),
    column(9, plotOutput("hist"))
  )
)

server <- function(input, output, session) {
  timer <- reactiveTimer(500)

  x1 <- reactive({
    timer()
    rpois(input$n, input$lambda1)
  })
  x2 <- reactive({
    timer()
    rpois(input$n, input$lambda2)
  })

  output$hist <- renderPlot({
    freqpoly(x1(), x2(), binwidth = 1, xlim = c(0, 40))
  }, res = 96)
}

shinyApp(ui, server)

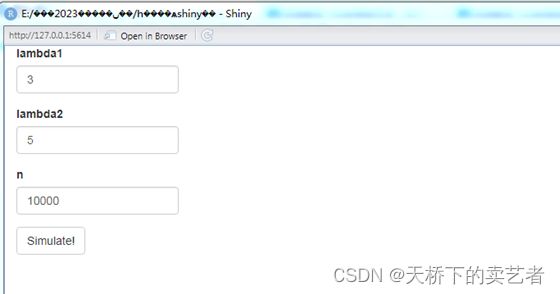
加入点击按钮actionButton,就可以根据点击按钮进行绘图
ui <- fluidPage(
  fluidRow(
    column(3,
      numericInput("lambda1", label = "lambda1", value = 3),
      numericInput("lambda2", label = "lambda2", value = 5),
      numericInput("n", label = "n", value = 1e4, min = 0),
      actionButton("simulate", "Simulate!")
    ),
    column(9, plotOutput("hist"))
  )
)

server <- function(input, output, session) {
  x1 <- reactive({
    input$simulate
    rpois(input$n, input$lambda1)
  })
  x2 <- reactive({
    input$simulate
    rpois(input$n, input$lambda2)
  })
  output$hist <- renderPlot({
    freqpoly(x1(), x2(), binwidth = 1, xlim = c(0, 40))
  }, res = 96)
}

shinyApp(ui, server)

使用eventReactive函数来代替reactive,有触发时间的效果,不触发时是没有图片的
ui <- fluidPage(
  fluidRow(
    column(3,
           numericInput("lambda1", label = "lambda1", value = 3),
           numericInput("lambda2", label = "lambda2", value = 5),
           numericInput("n", label = "n", value = 1e4, min = 0),
           actionButton("simulate", "Simulate!")
    ),
    column(9, plotOutput("hist"))
  )
)

server <- function(input, output, session) {
  x1 <- eventReactive(input$simulate, {
    rpois(input$n, input$lambda1)
  })
  x2 <- eventReactive(input$simulate, {
    rpois(input$n, input$lambda2)
  })

  output$hist <- renderPlot({
    freqpoly(x1(), x2(), binwidth = 1, xlim = c(0, 40))
  }, res = 96)
}

shinyApp(ui, server)
