QChart折线图、饼状图、条形图、曲线图
QT有自带示例可以参考借鉴来做出一些折线图、饼状图、条形图、曲线图等内容,在日常工作中、生活中大概率都离不开表图的制作,相对于数据来说表图更为直观,所以熟悉表图的制作还是很有必要的。
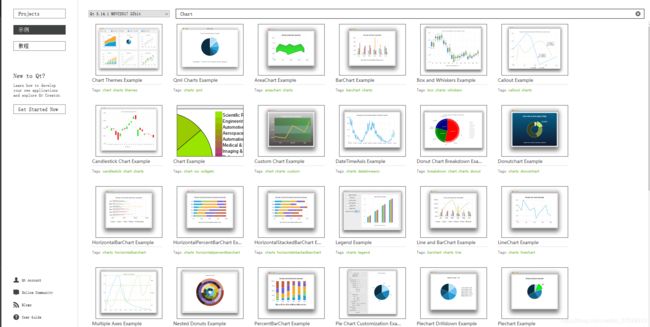
本文基于QT Creator所提供的Demo来做出示例,一下为QT自带的Demo。
本文作者原创,转载请附上文章出处与本文链接。
QChart折线图、饼状图、条形图、曲线图目录
1. 制作折线图
2. 制作饼状图
3. 制作条形图
4. 制作曲线图
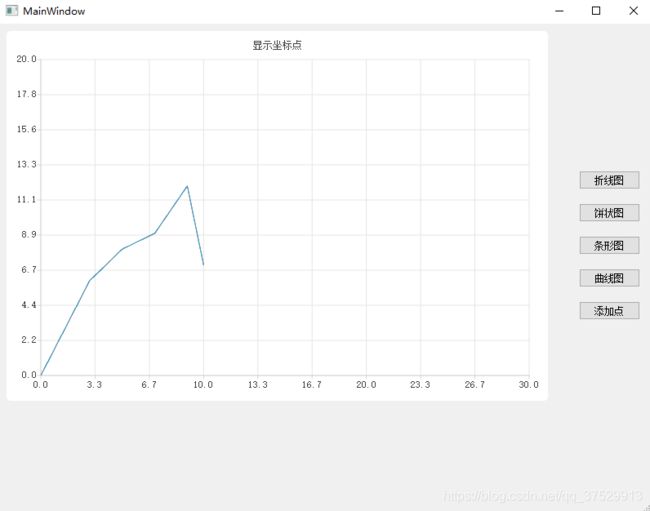
1. 制作折线图
    //series->clear();
    chart = new QChart();
    //设置线条名称
    series->setName(QString("line " + QString::number(1)));
    //设置线条颜色,如果不设置会给默认颜色
    series->setColor(QColor(32,159,223));
    //设置是否线条可视
    series->setVisible(true);
    //点标签是否可视
    series->setPointLabelsVisible(true);
    //点标签颜色
    series->setPointLabelsColor(QColor(255,255,255));
    //点标签字体
    series->setPointLabelsFont(QFont("微软雅黑"));
    //设置点标签显示格式
    series->setPointLabelsFormat("(@xPoint,@yPoint)");
    //是否切割边缘点标签,默认为true
    series->setPointLabelsClipping(false);
    //设置点标签是否可视
    series->setPointsVisible(true);

    // 添加实验数据,可以用 append 方法或者 >> 操作符
    series->append(0, 0);
    series->append(2, 4);
    series->append(3, 6);
    series->append(5, 8);
    series->append(7, 9);
    series->append(9, 12);
    series->append(10, 7);


    QValueAxis *xAxis = new QValueAxis();
    QValueAxis *yAxis = new QValueAxis();

    xAxis->setRange(0, 30);
    yAxis->setRange(0, 20);

    // 轴标题设置
    //xAxis->setTitleText("时间");
    //xAxis->setTitleFont(QFont("宋体"));
    QBrush brush;
    brush.setStyle(Qt::SolidPattern);
    xAxis->setTitleBrush(brush);
    yAxis->setTitleBrush(brush);

    // 轴标签设置
    //xAxis->setLabelFormat("%s");
    //yAxis->setLabelFormat("%s");
    //xAxis->setLabelFormat("%.1f");
    //xAxis->setLabelsAngle(45);
    //xAxis->setLabelsColor(Qt::blue);
    //xAxis->setLabelsEditable(true);

    // 轴线和刻度线设置
    xAxis->setTickCount(10);
    yAxis->setTickCount(10);
    xAxis->setLineVisible(true);
    yAxis->setLineVisible(true);
    //xAxis->setLinePenColor(Qt::blue);

    // 主网格线设置
    xAxis->setGridLineVisible(true);

    //xAxis->setGridLineColor(Qt::black);
    xAxis->setGridLineColor(QColor(230,229,229));
    yAxis->setGridLineColor(QColor(230,229,229));

    //次刻度和次网格线设置
    //xAxis->setMinorTickCount(1);
    //xAxis->setMinorGridLineColor(Qt::red);

    // 将图例隐藏
    chart->legend()->hide();
    // 关联series,这一步很重要,必须要将series关联到QChart才能将数据渲染出来:
    chart->addSeries(series);

    chart->addAxis(xAxis, Qt::AlignBottom);
    chart->addAxis(yAxis, Qt::AlignLeft);

    series->attachAxis(xAxis);
    series->attachAxis(yAxis);

    // 开启OpenGL,QLineSeries支持GPU绘制,Qt其他有的图表类型是不支持的。
    series->setUseOpenGL(true);
    // 创建默认的坐标系
    //chart->createDefaultAxes();
    // 设置图表标题
    chart->setTitle("显示坐标点");
    chart->setMargins(QMargins(10, 10, 10, 10));

    chartView = new QChartView(chart);
    chartView->setRenderHint(QPainter::Antialiasing); //抗锯齿处理
    //chartView->chart()->setTheme(QChart::ChartThemeBlueCerulean);
    ui->gridLayout->addWidget(chartView, 1, 0);
    m_charts << chartView;
    setLayout(ui->gridLayout);
2. 制作饼状图
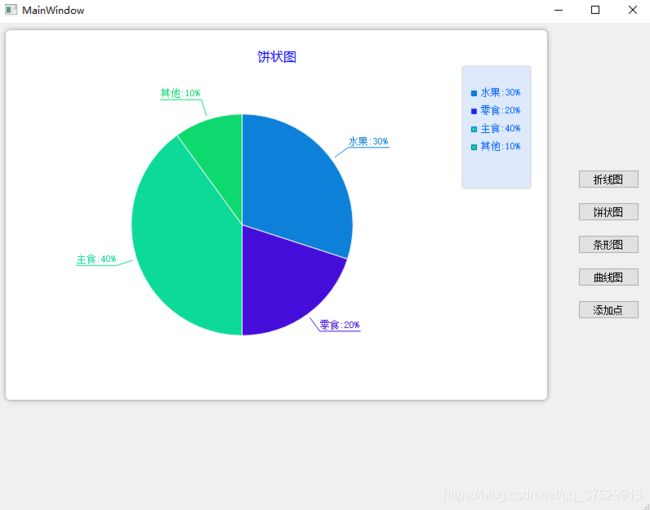
    chart = new QChart();
    QPieSeries *series = new QPieSeries();    //连续的餅图数据
    series->append("水果:30%", 3);    //添加标签"水果:30%" 和 百分值30%
    series->append("零食:20%", 2);
    series->append("主食:40%", 4);
    series->append("其他:10%", 1);

    series->setLabelsVisible(true);
    series->setUseOpenGL(true);
    series->slices().at(0)->setColor(QColor(13, 128, 217)); //设置颜色
    series->slices().at(0)->setLabelColor(QColor(13, 128, 217));
    series->slices().at(1)->setColor(QColor(69, 13, 217));
    series->slices().at(1)->setLabelColor(QColor(69, 13, 217));
    series->slices().at(2)->setColor(QColor(13, 217, 152));
    series->slices().at(2)->setLabelColor(QColor(13, 217, 152));
    series->slices().at(3)->setColor(QColor(13, 217, 110));
    series->slices().at(3)->setLabelColor(QColor(13, 217, 110));

    chart->setTheme(QChart::ChartThemeLight);//设置白色主题
    chart->setDropShadowEnabled(true);//背景阴影
    chart->addSeries(series);//添加系列到QChart上

    chart->setTitleBrush(QBrush(QColor(0, 0, 255))); //设置标题Brush
    chart->setTitleFont(QFont("微软雅黑"));//设置标题字体
    chart->setTitle("饼状图");

    //修改说明样式
    chart->legend()->setVisible(true);
    chart->legend()->setAlignment(Qt::AlignRight);//底部对齐
    chart->legend()->setBackgroundVisible(true);//设置背景是否可视
    chart->legend()->setAutoFillBackground(true);//设置背景自动填充
    chart->legend()->setColor(QColor(222, 233, 251)); //设置颜色
    chart->legend()->setLabelColor(QColor(0, 100, 255)); //设置标签颜色
    chart->legend()->setMaximumHeight(150);

    QChartView *chartView = new QChartView(chart);
    chartView->setRenderHint(QPainter::Antialiasing);

    QVBoxLayout *pVLayout = new QVBoxLayout(this);
    pVLayout->addWidget(chartView);
    ui->gridLayout->addWidget(chartView, 1, 0);
    m_charts << chartView;
    setLayout(ui->gridLayout);
3. 制作条形图
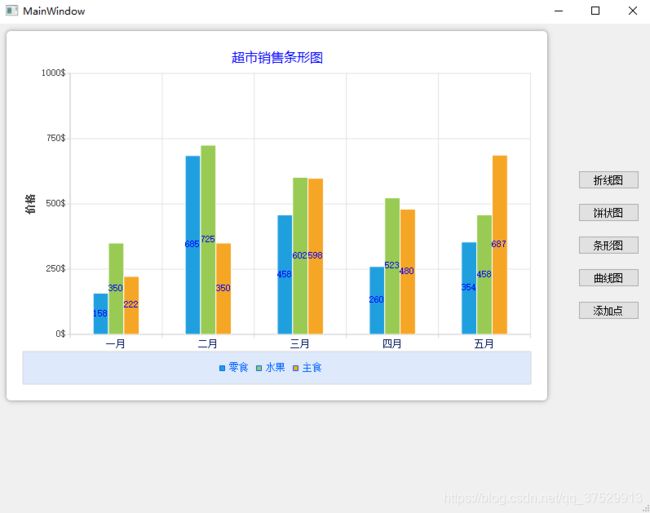
    chart = new QChart();
    //创建3个条线数据
    QBarSet *set0 = new QBarSet("零食");
    QBarSet *set1 = new QBarSet("水果");
    QBarSet *set2 = new QBarSet("主食");

    *set0 << 158 << 685 << 458 << 260 << 354;    //向零食数据添加这4个月的销售数据
    *set1 << 350 << 725 << 602 << 523 << 458;
    *set2 << 222 << 350 << 598 << 480 << 687;

    set0->setLabelColor(QColor(0,0,255));       //设置条形数据颜色
    set1->setLabelColor(QColor(0,0,255));
    set2->setLabelColor(QColor(0,0,255));

    QBarSeries *series = new QBarSeries();

    //series->setLabelsPosition(QAbstractBarSeries::LabelsInsideEnd);
    //series->setLabelsVisible(true);

    series->append(set0);
    series->append(set1);
    series->append(set2);
    series->setVisible(true);
    series->setLabelsVisible(true);

    chart->setTheme(QChart::ChartThemeLight);//设置白色主题
    chart->setDropShadowEnabled(true);//背景阴影
    chart->addSeries(series);//添加系列到QChart上

    chart->setTitleBrush(QBrush(QColor(0,0,255)));//设置标题Brush
    chart->setTitleFont(QFont("微软雅黑"));//设置标题字体
    chart->setTitle("超市销售条形图");

    //创建X轴和Y轴
    QBarCategoryAxis *axisX = new QBarCategoryAxis;
    axisX->append("一月");
    axisX->append("二月");
    axisX->append("三月");
    axisX->append("四月");
    axisX->append("五月");
    axisX->setLabelsColor(QColor(7,28,96));

    QValueAxis *axisY = new QValueAxis;
    axisY->setRange(0,1000);   //改为setRange(0,1);则表示坐标为动态计算大小的
    axisY->setTitleText("价格");
    axisY->setLabelFormat("%d$");

    chart->setAxisX(axisX,series);
    chart->setAxisY(axisY,series);

    //修改说明样式
    chart->legend()->setVisible(true);
    chart->legend()->setAlignment(Qt::AlignBottom);//底部对齐
    chart->legend()->setBackgroundVisible(true);//设置背景是否可视
    chart->legend()->setAutoFillBackground(true);//设置背景自动填充
    chart->legend()->setColor(QColor(222,233,251));//设置颜色
    chart->legend()->setLabelColor(QColor(0,100,255));//设置标签颜色
    chart->legend()->setMaximumHeight(50);

    QChartView *chartView = new QChartView(chart);
    chartView->setRenderHint(QPainter::Antialiasing);

    QVBoxLayout *pVLayout = new QVBoxLayout(this);
    pVLayout->addWidget(chartView);
    ui->gridLayout->addWidget(chartView, 1, 0);
    m_charts << chartView;
    setLayout(ui->gridLayout);
4. 制作曲线图
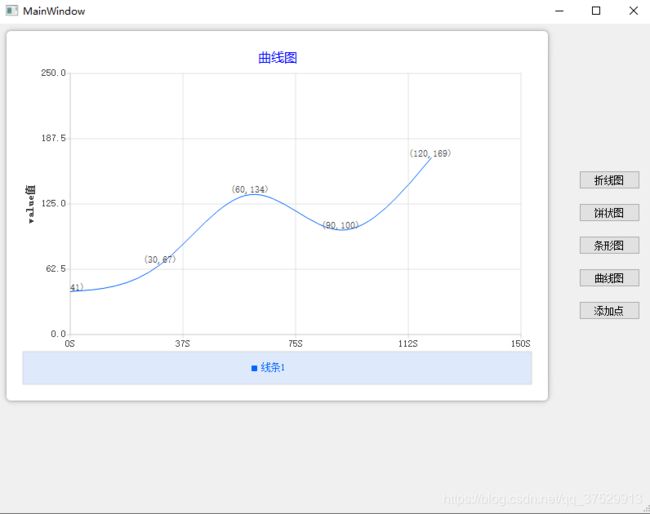
    chart = new QChart();
    QSplineSeries *series1 = new QSplineSeries();//实例化一个QLineSeries对象
    series1->setColor(QColor(0,100,255));
    series1->append(QPointF(0,qrand()%200)) ;
    series1->append(QPointF(30,qrand()%200)) ;
    series1->append(QPointF(60,qrand()%200)) ;
    series1->append(QPointF(90,qrand()%200)) ;
    series1->append(QPointF(120,qrand()%200)) ;
    series1->setName("线条1");

    series1->setVisible(true);
    series1->setPointLabelsFormat("(@xPoint,@yPoint)");
    series1->setPointLabelsVisible(true);

    chart->setTheme(QChart::ChartThemeLight);//设置白色主题
    chart->setDropShadowEnabled(true);//背景阴影    m_chart->setAutoFillBackground(true);  //设置背景自动填充
    chart->addSeries(series1);//添加系列到QChart上


    chart->setTitleBrush(QBrush(QColor(0,0,255)));//设置标题Brush
    chart->setTitleFont(QFont("微软雅黑"));//设置标题字体
    chart->setTitle("曲线图");


    //创建X轴和Y轴
    QValueAxis *axisX = new QValueAxis;
    axisX->setRange(0,150);    //默认则坐标为动态计算大小的
    axisX->setLabelFormat("%dS");
    QValueAxis *axisY = new QValueAxis;
    axisY->setRange(0,250);    //默认则坐标为动态计算大小的
    axisY->setTitleText("value值");

    chart->setAxisX(axisX,series1);
    chart->setAxisY(axisY,series1);
    //m_chart->createDefaultAxes();             //或者创建默认轴

    //修改说明样式
    chart->legend()->setVisible(true);
    chart->legend()->setAlignment(Qt::AlignBottom);//底部对齐
    chart->legend()->setBackgroundVisible(true);//设置背景是否可视
    chart->legend()->setAutoFillBackground(true);//设置背景自动填充
    chart->legend()->setColor(QColor(222,233,251));//设置颜色
    chart->legend()->setLabelColor(QColor(0,100,255));//设置标签颜色
    chart->legend()->setMaximumHeight(50);
    QChartView *chartView = new QChartView(chart);
    chartView->setRenderHint(QPainter::Antialiasing);

    QVBoxLayout *pVLayout = new QVBoxLayout(this);
    pVLayout->addWidget(chartView);

    ui->gridLayout->addWidget(chartView, 1, 0);
    m_charts << chartView;
    setLayout(ui->gridLayout);
其它文章 :
QT TextEdit控件_双子座断点的博客-CSDN博客_qt textedit
QT QComboBox使用详解_双子座断点的博客-CSDN博客
QT QtableView操作详解_双子座断点的博客-CSDN博客_qtableview增删改查
Qt QStandardItemModel(1.超级详细用法)_双子座断点的博客-CSDN博客_qstandardmodel
Qt QStandardItemModel(2.超级详细函数)_双子座断点的博客-CSDN博客_qstandarditemmodel点击事件
QT QRadioButton使用详解_双子座断点的博客-CSDN博客_qt radiobutton
QT QLineEdit使用详解_双子座断点的博客-CSDN博客_qt qlineedit
Qt QMessageBox使用详解_双子座断点的博客-CSDN博客_qt message
QChart折线图、饼状图、条形图、曲线图_双子座断点的博客-CSDN博客_qchart样式
QChart属性详解_双子座断点的博客-CSDN博客_setanimationoptions
QCharts QValueAxis使用_双子座断点的博客-CSDN博客_qvalueaxis
Qt 5 等待提示框(开源 动态图)_双子座断点的博客-CSDN博客_qt 等待对话框
QtDataVisualization 数据3D可视化_双子座断点的博客-CSDN博客_qtdatavisualization