import sympy as sy
import numpy as np
import matplotlib.pyplot as plt
from matplotlib.animation import FuncAnimation
b,c,d,e,L,F,S=sy.symbols("b,c,d,e,L,F,S")
k1=2*d*c
k2=-2*S*c
k3=S**2-b**2+c**2+d**2
pu=2*sy.atan((-k1+sy.sqrt(k1**2+k2**2-k3**2))/(k3-k2))
fi=sy.atan((d+c*sy.sin(pu))/(S-c*sy.cos(pu)))
F23=F*(L*sy.cos(pu)+e*sy.sin(pu))/(c*sy.sin(fi+pu))
F1=2*F23*sy.cos(fi)
Ax=-S
Bx=-S+b*sy.cos(fi)
By=b*sy.sin(fi)
B1x=-Bx
B1y=d-c*sy.sin(pu)
acx=sy.lambdify(S,Ax.subs({b:80,c:50,d:70,e:20,L:100,F:1200}),modules='numpy')
bx=sy.lambdify(S,Bx.subs({b:80,c:50,d:70,e:20,L:100,F:1200}),modules='numpy')
by=sy.lambdify(S,By.subs({b:80,c:50,d:70,e:20,L:100,F:1200}),modules='numpy')
b1x=sy.lambdify(S,B1x.subs({b:80,c:50,d:70,e:20,L:100,F:1200}),modules='numpy')
b1y=sy.lambdify(S,B1y.subs({b:80,c:50,d:70,e:20,L:100,F:1200}),modules='numpy')


fig,ax = plt.subplots()
plt.rcParams['xtick.direction'] = 'in'  # 将x周的刻度线方向设置向内
plt.rcParams['ytick.direction'] = 'in'  # 将y轴的刻度方向设置向内
plt.rcParams['axes.unicode_minus']=False
# plt.rcParams['font.family'] = ["Times New Roman"]  # 字体设置为Times NewRoman
plt.rcParams['font.sans-serif'] = ['SimHei']
clist = ['blue', 'red', 'green', 'black', 'darkgreen', 'lime', 'gold', 'purple', 'green', 'cyan', 'salmon', 'grey',
         'mediumvioletred', 'darkkhaki', 'gray', 'darkcyan', 'violet', 'powderblue']
markerlst = ['o', '*', 'x', '>', '<', '^', 'D', 'd', '1', '2', '3', '4', 'o', '*', 'x', '>', '<', '^', 'D', 'd',
             '1', '2', '3', '4', 'o', '*', 'x', '>', '<', '^', 'D', 'd', '1', '2', '3', '4']
linestylelst = ['-', '--', '-.', ':', '-', '--', '-.', ':', '-', '--', '-.', ':', '-', '--', '-.', ':', '-', '--',
                '-.', ':', '-', '--', '-.', ':']
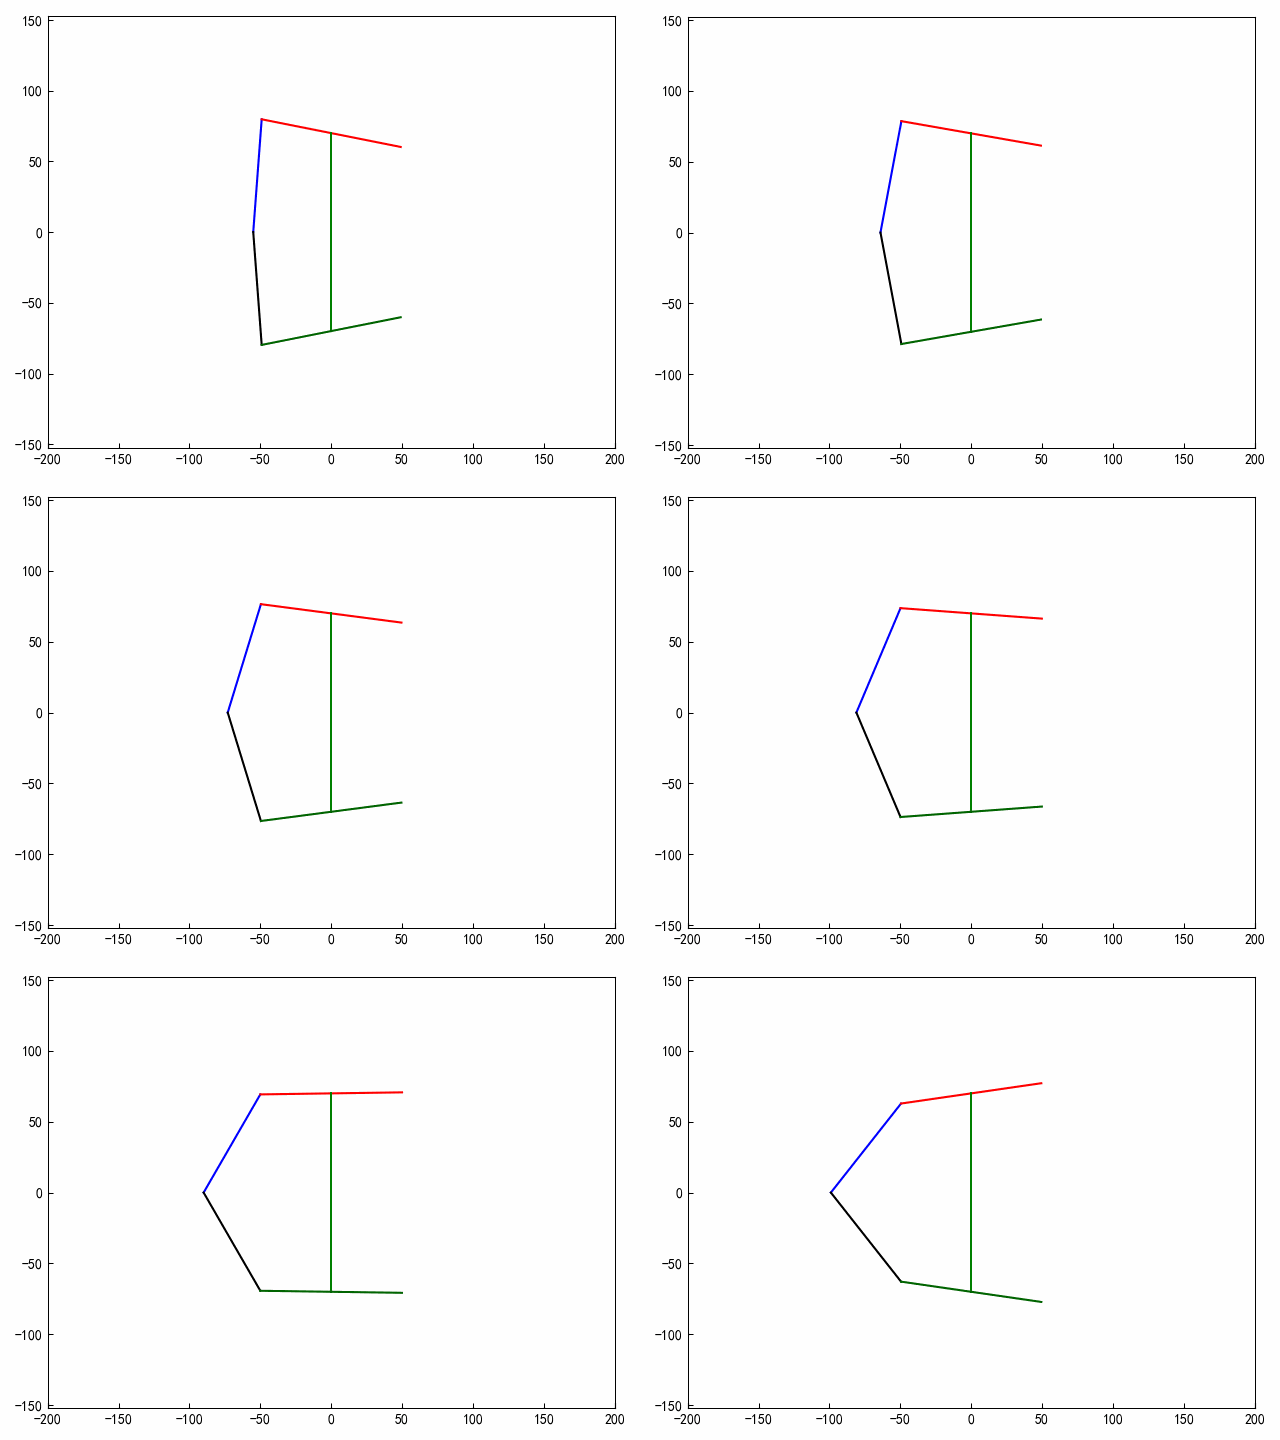
def draw_frame(i):
    s=100-i
    xa=acx(s)
    ya=0
    xb=bx(s)
    yb=by(s)
    xb1 = b1x(s)
    yb1 = b1y(s)
    xc=0
    yc=70
    ax.clear()
    ax.plot([xa,xb],[ya,yb],c=clist[0])
    ax.plot([xb1, xb], [yb1, yb], c=clist[1])
    ax.plot([xc, xc], [-yc, yc], c=clist[2])
    ax.plot([xa, xb], [ya, -yb], c=clist[3])
    ax.plot([xb1, xb], [-yb1, -yb], c=clist[4])
    ax.axis('equal')
    ax.set_xlim(xmin=-200,xmax=200)
    ax.set_ylim(ymin=-200, ymax=200)
    plt.tight_layout()


anim=FuncAnimation(fig,draw_frame,frames=45,interval=50)
anim.save("d2.gif",writer='pillow')


