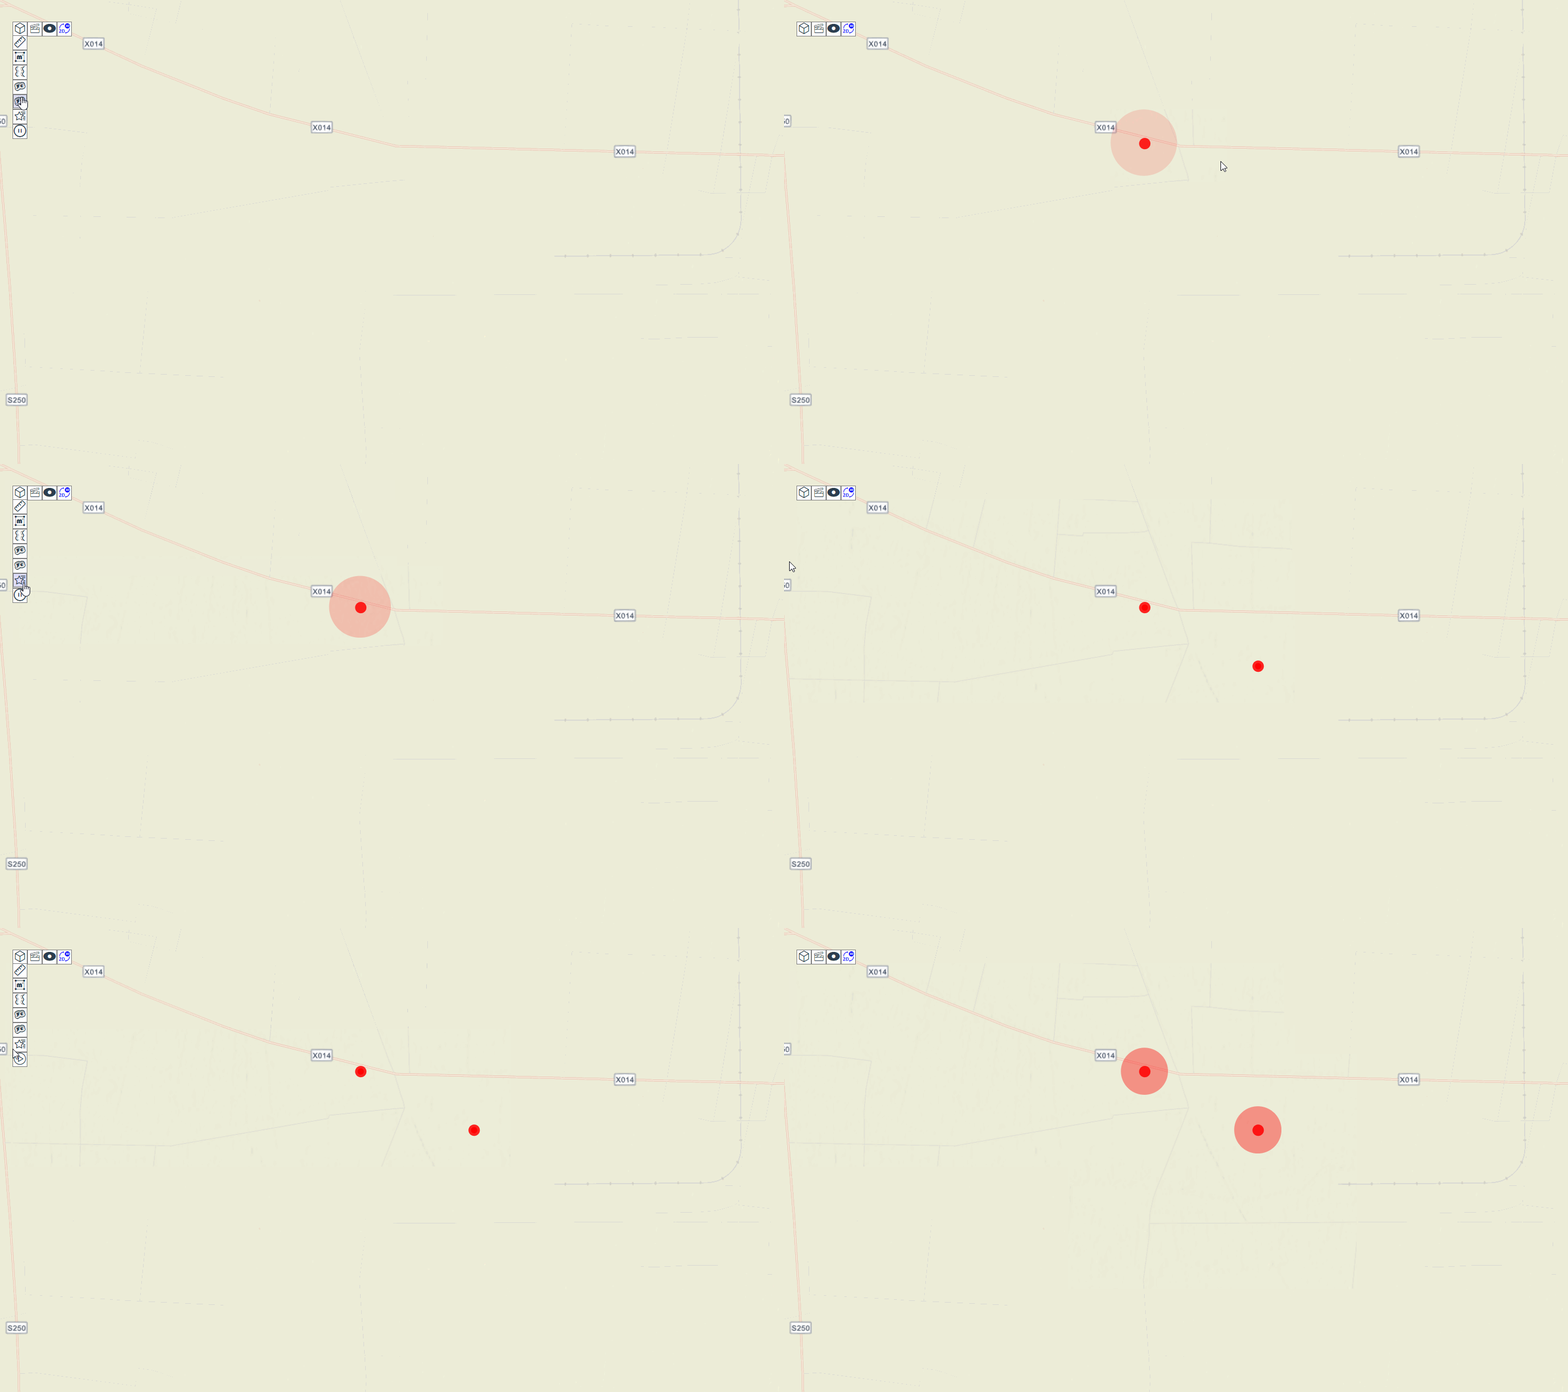
ArcGIS API for JavaScript 4.x 实现动态脉冲效果
1. 设计思路
主要通过定时刷新,每一次的脉冲渲染圈不停的放大,并且透明度缩小,直到达到一定的大小再退回0。
2. 实现代码
import MapView from "@arcgis/core/views/MapView";
import GraphicsLayer from "@arcgis/core/layers/GraphicsLayer";
import Point from "@arcgis/core/geometry/Point";
import SimpleMarkerSymbol from "@arcgis/core/symbols/SimpleMarkerSymbol"
import Graphic from "@arcgis/core/Graphic";
import SceneView from "@arcgis/core/views/SceneView";

export class FlashPointLayer{
    view: MapView | SceneView;
    flashLayer:GraphicsLayer
    piontArr:Point[]
    size:number
    alpha:number
    markerSymbol:SimpleMarkerSymbol
    animationId:number
    constructor(view:MapView | SceneView){
        this.view = view
        this.flashLayer = new GraphicsLayer({
            id: 'flashLayer',
            title: 'flashLayer',
        })
        this.piontArr = []
        this.markerSymbol = new SimpleMarkerSymbol({
            style:'circle',
            size:15,
            color:[255, 0, 0, 0.85],
            outline:{
                color: [ 0,0,0,0]
            }
        });
        this.size = 5
        this.alpha = (101-this.size)/100
        this.animationId = 0
        this.startAnimation()
    }
    //添加多个闪烁点
    addManyPoint(pointArr:number[][]){
        pointArr.forEach(point=>{
            this.piontArr.push(new Point({
                x: point[0],
                y: point[1],
                spatialReference: this.view.spatialReference,
            }))
        })
    }
    //添加单个闪烁点
    addPoint(lon:number,lat:number){
        const point =  new Point({
            x: lon,
            y: lat,
            spatialReference: this.view.spatialReference,
          });
          this.piontArr.push(point)
    }
    //启动动画
    startAnimation = ()=>{
        const centerGraphicArr:Graphic[] = []
        const rippleGraphicArr:Graphic[] = []
        this.size = this.size>99?0:this.size+2
        this.alpha = (101- this.size)/100;
        this.piontArr.forEach(point=>{
            centerGraphicArr.push(new Graphic({
                geometry:point,
                symbol:this.markerSymbol
            }))
            rippleGraphicArr.push(new Graphic({
                geometry:point,
                symbol:new SimpleMarkerSymbol({
                    style:'circle',
                    size:this.size,
                    color:[255, 0, 0, this.alpha],
                    outline:{
                        color: [ 0,0,0,0]
                    }
                })
            }))
        })
        this.flashLayer.removeAll();
        this.flashLayer.addMany(centerGraphicArr)
        this.flashLayer.addMany(rippleGraphicArr)
        this.view.map.remove(this.flashLayer)
        this.view.map.add(this.flashLayer)
        this.animationId = window.requestAnimationFrame(this.startAnimation);
    }
    //暂停动画
    pauseAnimation = ()=>{
        window.cancelAnimationFrame(this.animationId)
    }
}
这个文件拿去可以直接使用,下面是引入的方式:
//这里需要传入MapView或者ScanView
let flashPointLayer = new FlashPointLayer(viewHandler.getView())
然后可以调用提供的方法实现动态点的添加,动画的暂停和启动。
