机器学习实战-系列教程4:手撕线性回归3之多特征线性回归(项目实战、原理解读、源码解读)
机器学习 实战系列 总目录
本篇文章的代码运行界面均在Pycharm中进行
本篇文章配套的代码资源已经上传
手撕线性回归1之线性回归类的实现
手撕线性回归2之单特征线性回归
手撕线性回归3之多特征线性回归
手撕线性回归4之非线性回归
8、多特征回归模型
前面我们介绍了线性回归一个比较完成的流程以及相应的源码解读,但是仅仅是一个特征对一个特征进行映射,这部分内容开始实现多特征对一个特征进行映射。
8.1 读入数据
import numpy as np
import pandas as pd
import matplotlib.pyplot as plt
import plotly
import plotly.graph_objs as go
plotly.offline.init_notebook_mode()
from linear_regression import LinearRegression
data = pd.read_csv('../data/world-happiness-report-2017.csv')
train_data = data.sample(frac=0.8)
test_data = data.drop(train_data.index)
input_param_name_1 = 'Economy..GDP.per.Capita.'
input_param_name_2 = 'Freedom'
output_param_name = 'Happiness.Score'
x_train = train_data[[input_param_name_1, input_param_name_2]].values
y_train = train_data[[output_param_name]].values

x_test = test_data[[input_param_name_1, input_param_name_2]].values
y_test = test_data[[output_param_name]].values
- 导包都是一样的
- 读数据,分成训练集、测试集
- 原始数据这次读入两个特征,标签数据不变
- 分别获取训练集的数据与标签,测试集的数据与标签
8.2 数据展示
8.2.1 训练数据轨迹
# Configure the plot with training dataset.
plot_training_trace = go.Scatter3d(
    x=x_train[:, 0].flatten(),
    y=x_train[:, 1].flatten(),
    z=y_train.flatten(),
    name='Training Set',
    mode='markers',
    marker={
        'size': 10,
        'opacity': 1,
        'line': {
            'color': 'rgb(255, 255, 255)',
            'width': 1
        },
    }
)
8.2.2 测试数据轨迹
这里是训练的数据的画图展示,将输入的两个特征与标签对应了三个维度:
- 3d图有x、y、z三个轴,我们用两个输入数据x1和x2,以及预测数据y与其对应
- 名字、形状(这里是散点)、线条
- 线条里面的颜色、宽度
plot_test_trace = go.Scatter3d(
    x=x_test[:, 0].flatten(),
    y=x_test[:, 1].flatten(),
    z=y_test.flatten(),
    name='Test Set',
    mode='markers',
    marker={
        'size': 10,
        'opacity': 1,
        'line': {
            'color': 'rgb(255, 255, 255)',
            'width': 1
        },
    }
)
8.2.3 画图布局
同样的,这是测试数据的展示
plot_layout = go.Layout(
    title='Date Sets',
    scene={
        'xaxis': {'title': input_param_name_1},
        'yaxis': {'title': input_param_name_2},
        'zaxis': {'title': output_param_name}
    },
    margin={'l': 0, 'r': 0, 'b': 0, 't': 0}
)
画图的布局,x、y、z轴取名,图的取名,以及字体颜色设置
8.2.4 执行画图
plot_data = [plot_training_trace, plot_test_trace]
plot_figure = go.Figure(data=plot_data, layout=plot_layout)
plotly.offline.plot(plot_figure, filename='img.html', auto_open=True)
- 传入两个轨迹
- 绘图操作
- 保存为html文件,弹出浏览器(这里一定会在项目中生成一个html文件,但是是不是自动弹出取决于你的pycharm和系统设置,可以在本地文件中打开这个html文件)
9、训练
9.1 执行训练
num_iterations = 500
learning_rate = 0.01
polynomial_degree = 0
sinusoid_degree = 0
linear_regression = LinearRegression(x_train, y_train, polynomial_degree, sinusoid_degree)
(theta, cost_history) = linear_regression.train( learning_rate, num_iterations)
print('开始损失',cost_history[0])
print('结束损失',cost_history[-1])
- 迭代次数
- 学习率
- 非线性变换中用到的
- 非线性变换中用到的
- 调用线性回归类,生成对象
- 执行训练函数,执行过程中会和前面一样调用多个函数
- 打印开始损失
- 打印结束损失
打印结果:
开始损失 14.570028710012329
结束损失 0.18006554243827635
9.2 打印损失下降过程
plt.plot(range(num_iterations), cost_history)
plt.xlabel('Iterations')
plt.ylabel('Cost')
plt.title('Gradient Descent Progress')
plt.show()
- 迭代次数和每次对应的损失作为x、y轴画图
- 画图参数
10、测试与回归线:散点图
10.1 预测
predictions_num = 10
x_min = x_train[:, 0].min()
x_max = x_train[:, 0].max()
y_min = x_train[:, 1].min()
y_max = x_train[:, 1].max()
x_axis = np.linspace(x_min, x_max, predictions_num)
y_axis = np.linspace(y_min, y_max, predictions_num)
x_predictions = np.zeros((predictions_num * predictions_num, 1))
y_predictions = np.zeros((predictions_num * predictions_num, 1))
x_y_index = 0
for x_index, x_value in enumerate(x_axis):
    for y_index, y_value in enumerate(y_axis):
        x_predictions[x_y_index] = x_value
        y_predictions[x_y_index] = y_value
        x_y_index += 1

z_predictions = linear_regression.predict(np.hstack((x_predictions, y_predictions)))
- 选出10条的数据, x 1 x_1 x1、 x 2 x_2 x2、y,分别对应x轴、y轴、z轴
- x 1 x_1 x1最小值
- x 1 x_1 x1最大值
- x 2 x_2 x2最小值
- x 2 x_2 x2最大值
- 把 x 1 x_1 x1最小值和最大值作为取值范围,均匀取出10个值,对应x轴
- 把 x 2 x_2 x2最小值和最大值作为取值范围,均匀取出10个值,对应y轴
- 创建一个有10个数的一组数组,值全为0,作为3d画图中x轴的数据x_predictions
- 创建一个有10个数的一组数组,值全为0,作为3d画图中y轴的数据y_predictions
- 把前面 x_axis和y_axis的数据赋值给x_predictions和y_predictions
- 通过线性回归类的对象调用测试集预测函数生成预测结果
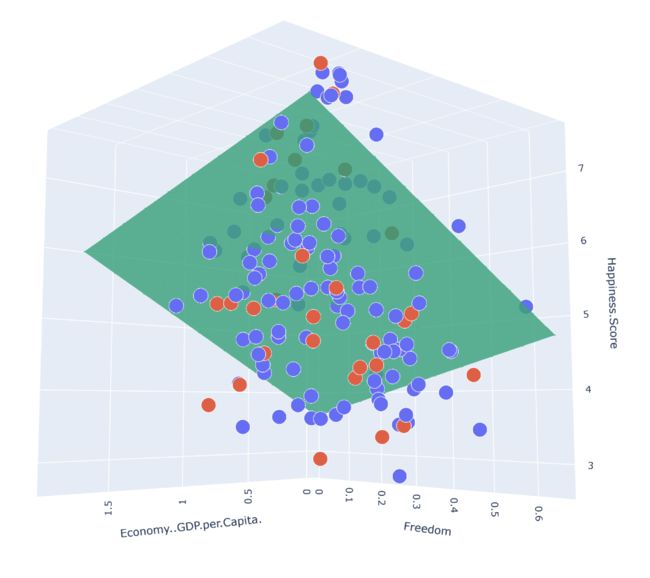
10.2 预测结果3d三点图
plot_predictions_trace = go.Scatter3d(
    x=x_predictions.flatten(),
    y=y_predictions.flatten(),
    z=z_predictions.flatten(),
    name='Prediction Plane',
    mode='markers',
    marker={ 'size': 1,},
    opacity=0.8,
    surfaceaxis=2,
)

plot_data = [plot_training_trace, plot_test_trace, plot_predictions_trace]
plot_figure = go.Figure(data=plot_data, layout=plot_layout)
plotly.offline.plot(plot_figure)
这里的画图的过程和前面都是一样的,就不再解释了哦
打印结果:

手撕线性回归1之线性回归类的实现
手撕线性回归2之单特征线性回归
手撕线性回归3之多特征线性回归
手撕线性回归4之非线性回归

