VUE大屏数据面板
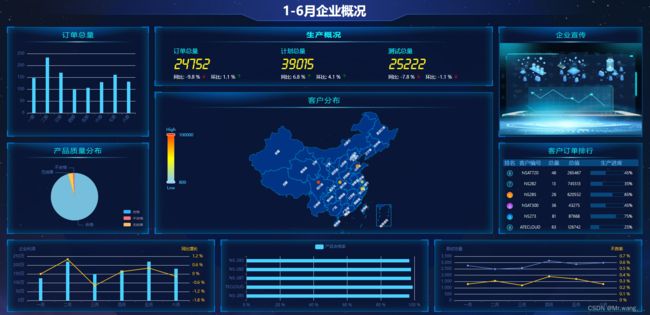
基于VUE写的数据看板,有九个模块,分别为:订单总量(柱状图),生产概况(数字面板),企业宣传(轮播图),产品质量分析(饼状图),客户分布(地图且有标点信息),客户订单排行(上下滚动),企业利润分析(柱折线图),合格率分析(横柱状图),测试分析(双折线图)。项目打开npm install;npm run dev即可使用。数据可以动态赋予,本项目暂用的静态数据。
项目链接 https://download.csdn.net/download/qq_30258721/85762901

<template>
    <div ref="geoEcharts" class="geo-echart">div>
template>

<script>
import axios from 'axios'
const HTTP_GEOJSON = 'https://geo.datav.aliyun.com/areas_v3/bound/100000_full.json';// 地图数据

export default {
  name: 'HelloWorld',
  data() {
    return {

    }
  },
  props: {
    geoData :{
      type: Array,
    },
    geoRegion :{
      type: Object,
    },
  },
  mounted(){
    this.initGeoEcharts(); // 客户分布模块
  },
  methods: {
    initGeoEcharts() {
      axios.get(HTTP_GEOJSON).then(res => {
         this.echarts.registerMap('china', res.data)
          this.$nextTick(() => {
            const map = this.echarts.init(this.$refs.geoEcharts, null, {renderer:'svg'})
            const option = {
              // 悬浮窗
              tooltip: {
                trigger: 'item',
                backgroundColor: '#0C134B',
                borderColor: '#007BE6',
                textStyle: { // 提示框浮层的文本样式。
                  color: '#fff',
                  fontStyle: 'normal',
                  fontWeight: 'normal',
                },
                formatter: function(params) {
                  return `
                    ${params.name}
                    客户数量:${params.value[2]}
近半年产值:${params.value[3]}
总产值: ${params.value[4]}
                  `
                },
                confine: true
              },
              // 图例
              visualMap: {
                min: 800,
                max: 100000,
                top: 100,
                left: 20,
                text: ['High', 'Low'],
                realtime: false,
                calculable: true,
                inRange: {
                    color: ['lightskyblue', 'yellow', 'orangered']
                },
                textStyle: {
                    color: this.FONT_COLOR,
                },
              },
              geo: {
                map: 'china',
                zoom: 1,
                roam: 'move',
                nameMap: this.geoRegion,
                label: {
                  show: true,
                  color: 'white',
                  position: "inside",
                  fontSize: 8,
                  rotate: 45
                },
                itemStyle: {  // 所有地图的区域颜色
                  areaColor: 'rgba(0,60,153,0.8)',
                  borderColor: '#02c0ff'
                },
                emphasis: {
                  itemStyle: {
                    areaColor: 'rgba(0,60,153,0.5)',
                    shadowColor: 'rgba(0,0,0,0.8)',
                    shadowBlur: 5,
                    shadowOffsetY: 5
                  }
                },
              },
              // 数据
              series: {
                  type: 'scatter',
                  coordinateSystem: 'geo',
                  data: this.geoData,
                  SymbolSize: 4
                }
            }
            map.setOption(option)
          })
      })
    },
  },
}
script>


<style scoped>
@import "../assets/css/style.css";
style>