python15种3D绘图函数总结
文章目录
-
-
- 基础图
- 三维图
- 误差线
- 等高线
- 场图
- 统计图
- 非结构坐标图
-
35种绘图函数总结28种极坐标绘图函数总结
基础图
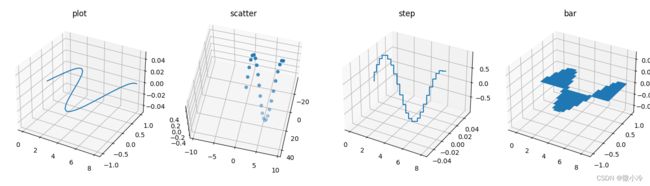
一般来说,二维绘图函数在不新增坐标轴的情况下,可以指定一个z轴方向,然后在z=0的平面内进行绘图,支持这种特性的函数有下面这几个
| 函数 | 坐标参数 | 图形类别 | |
|---|---|---|---|
| plot | x,y | 曲线图 | 默认z=0 |
| scatter | x,y | 散点图 | 默认z=0 |
| step | x,y | 步阶图 | 默认z=0 |
| bar | x,y | 条形图 | 默认z=0 |
import matplotlib.pyplot as plt
import numpy as np

x = np.arange(25)/3
y = np.sin(x)


keys = ["plot", "scatter", "step", "bar"]

fig = plt.figure(figsize=(14,4))
for i,key in enumerate(keys, 1):
    ax = fig.add_subplot(1, 4, i, projection="3d")
    fDct = {"plot" : ax.plot,  "scatter"  : ax.scatter,
            "step" : ax.step,  "bar"      : ax.bar}
    fDct[key](x,y)
    plt.title(key)

plt.tight_layout()
plt.show()
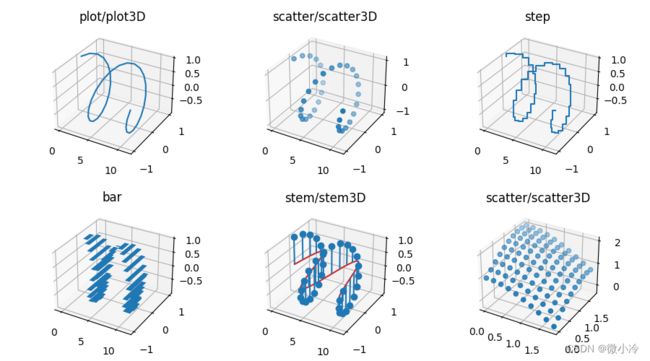
如果可以输入三个坐标,那么就不必指定zdir了,但x,y,z必须是一维数组,只有scatter例外。
| 函数 | 坐标参数 | 图形类别 | 同名函数 |
|---|---|---|---|
| plot | x, y, z | 曲线图 | |
| scatter | x, y, z | 散点图 | 可以是二维网格 |
| step | x, y, z | 步阶图 | |
| bar | x, y, z | 条形图 | |
| stem | x, y, z | 茎叶图 |
x = np.arange(35)/3
y, z = np.sin(x), np.cos(x)

fig = plt.figure(figsize=(9,5))

ax = fig.add_subplot(231, projection="3d")
ax.plot(x, y, z)
plt.title("plot/plot3D")

ax = fig.add_subplot(232, projection="3d")
ax.scatter(x, y, z)
plt.title("scatter/scatter3D")

ax = fig.add_subplot(233, projection="3d")
ax.step(x, y, z)
plt.title("step")

ax = fig.add_subplot(234, projection="3d")
ax.bar(x, y, z)
plt.title("bar")

ax = fig.add_subplot(235, projection="3d")
ax.stem(x, y, z)
plt.title("stem/stem3D")

x,y = np.indices([10, 10])/5
z = np.cos(x)+np.sin(y)
ax = fig.add_subplot(236, projection="3d")
ax.scatter(x, y, z)
plt.title("scatter/scatter3D")

plt.tight_layout()
plt.show()
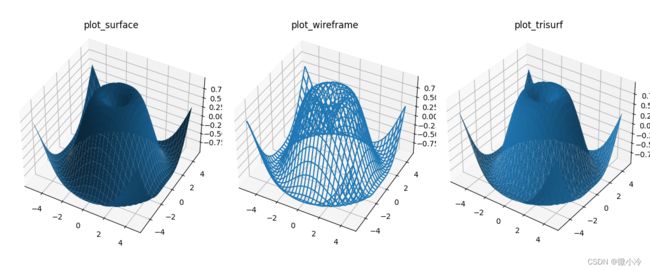
三维图
| 绘图函数 | 坐标 | 绘图类型 | 坐标说明 |
|---|---|---|---|
| plot_surface | x,y,z | 三维曲面图 | x,y必须是网格 |
| plot_wireframe | x,y,z | 三维网格图 | x,y必须是网格 |
| plot_trisurf | x,y,z | 三角曲面图 | x,y,z是一维数组 |
import matplotlib.pyplot as plt
from matplotlib import cm
import numpy as np

X, Y = np.indices([30, 30])/3 - 5
Z = np.sin(np.sqrt(X**2 + Y**2))

fig = plt.figure(figsize=(12,5))

ax = fig.add_subplot(131, projection='3d')
ax.plot_surface(X, Y, Z)
plt.title("plot_surface")

ax = fig.add_subplot(132, projection='3d')
ax.plot_wireframe(X, Y, Z)
plt.title("plot_wireframe")

ax = fig.add_subplot(133, projection='3d')
ax.plot_trisurf(X.reshape(-1), Y.reshape(-1), Z.reshape(-1))
plt.title("plot_trisurf")

plt.tight_layout()
plt.show()
误差线
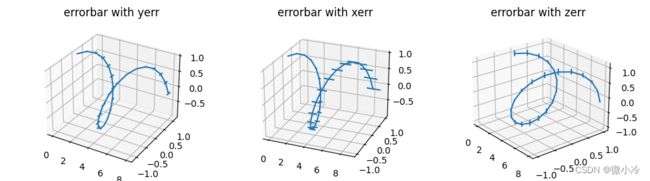
二维坐标中的误差线函数errorbar在三维投影下仍然适用,并且支持z方向的误差线
x = np.arange(25)/3
y = np.sin(x)
z = np.cos(x)
y1, y2 = 0.9*y, 1.1*y
x1, x2 = 0.9*x, 1.1*x
z1, z2 = 0.9*z, 1.1*z
xerr = np.abs([x1, x2])/10
yerr = np.abs([y1, y2])/10
zerr = np.abs([z1, z2])/10

fig = plt.figure(figsize=(10,3))

ax = fig.add_subplot(131, projection='3d')
ax.errorbar(x, y, z, yerr=yerr)
plt.title("errorbar with yerr")

ax = fig.add_subplot(132, projection='3d')
ax.errorbar(x, y, z, xerr=xerr)
plt.title("errorbar with xerr")

ax = fig.add_subplot(133, projection='3d')
ax.errorbar(x, y, z, zerr=zerr)
plt.title("errorbar with zerr")

plt.tight_layout()
plt.show()
效果如下
等高线
等高线理所当然地支持三维坐标图,毕竟在没有第三个轴的情况下,等高线图都会用伪彩色来显示高度,现在有了第三个轴,那必须得墙裂支持。
但对于contourf而言,并不会把登高平面衔接起来,所以看上去就像梯田一样,所以不建议在3D坐标中直接绘制contourf图像,而是声名一个z轴,绘制这个z轴方向的投影
X, Y = np.indices([100,100])/30 - 1.5
Z = (1 - X/2 + X**5 + Y**3) * np.exp(-X**2 - Y**2)

fig = plt.figure(figsize=(10,3))

ax = fig.add_subplot(131, projection='3d')
ax.contour(X, Y, Z)
plt.title("contour")


ax = fig.add_subplot(132, projection='3d')
ax.contourf(X, Y, Z)
plt.title("contourf")

ax = fig.add_subplot(133, projection='3d')
ax.contourf(X, Y, Z, zdir='y', offset=0)
plt.title("contourf with zdir=y")

plt.tight_layout()
plt.show()

其中,第三幅图是整个等高线图在z轴方向的投影,可以理解为左视图。
场图
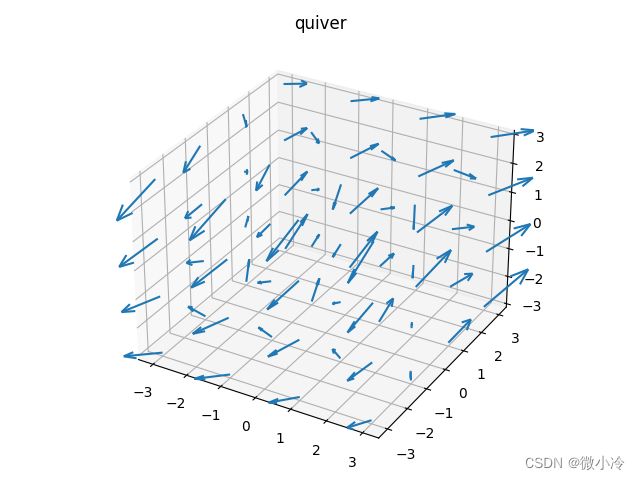
场图也是可以支持三维数据的,只不过需要6个坐标而已,记作x,y,z,u,v,w,但流场和风场就不支持三维图像了。
Y, X, Z = np.indices([4,4,4])/0.5 - 3
U = X + Y
V = Y - X
W = X + Y - Z

ax = plt.subplot(projection='3d')
ax.quiver(X, Y, Z, U, V, W,  length=0.2)
plt.title("quiver")


plt.tight_layout()
plt.show()
统计图
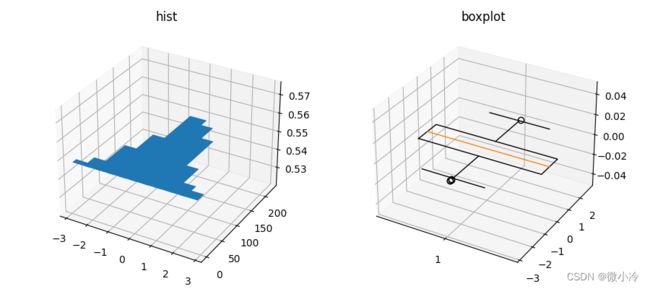
hist和boxplot在3D坐标中是可以绘制出来的,但是并不支持指定坐标轴,也不支持指定绘图位置,所以并不建议在3D坐标系中使用,下面仅做下展示
x = np.random.standard_normal(size=1000)

fig = plt.figure(figsize=(9,4))

ax = fig.add_subplot(121, projection='3d')
ax.hist(x)
plt.title("hist")


ax = fig.add_subplot(122, projection='3d')
ax.boxplot(x)
plt.title("boxplot")

plt.tight_layout()
plt.show()
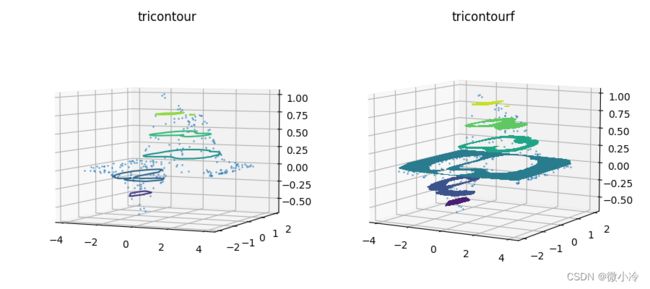
非结构坐标图
tricontour和tricontourf支持三维坐标,而triplot尽管在3维坐标系下不报错,但绘制的其实是二维图像,所以并不推荐。另一方面,和contourf类似,tricontourf所产生从登高面,同样并不会彼此衔接,所以观感其实是比较奇怪的,所以在三维坐标系中,比较推荐的非结构坐标图就只有tricontour这一个。
x = np.random.uniform(-4, 4, 256)
y = np.random.uniform(-2, 2, 256)
z = (1 - x/2 + x**5 + y**3) * np.exp(-x**2 - y**2)

levels = np.linspace(z.min(), z.max(), 7)

fig = plt.figure(figsize=(9,4))

ax = fig.add_subplot(121, projection='3d')
ax.plot(x, y, z, 'o', markersize=1, alpha=0.5)
ax.tricontour(x, y, z, levels=levels)
plt.title("tricontour")

ax = fig.add_subplot(122, projection='3d')
ax.plot(x, y, z, 'o', markersize=1, alpha=0.5)
ax.tricontourf(x, y, z, levels=levels)
plt.title("tricontourf")


plt.tight_layout()
plt.show()