R语言绘制热图
1、初步绘图
rm(list=ls())#clear Global Environment
setwd('D:/Desktop/0000/code-main/热图')#设置工作路径

#加载R包
library (pheatmap)
#读取数据
df <- read.table(file="data.txt",sep="\t",row.names = 1, header=T,check.names=FALSE)
#查看前3行
head(df)[1:5,]
####Z-score转换以保留数据的真实差异
df1 <-df[apply(df,1,var)!=0,]  ##去掉方差为0的行,也就是值全都一致的行
df_zscore <-as.data.frame(t(apply(df1,1,scale)))#标准化数据,获得Z-score
colnames(df_zscore)<- colnames(df)
###初步绘图
pheatmap(df_zscore,
         angle_col = "45",
         cellwidth=25, cellheight=8,
         treeheight_col = 15,
         filename = "heatmap.png")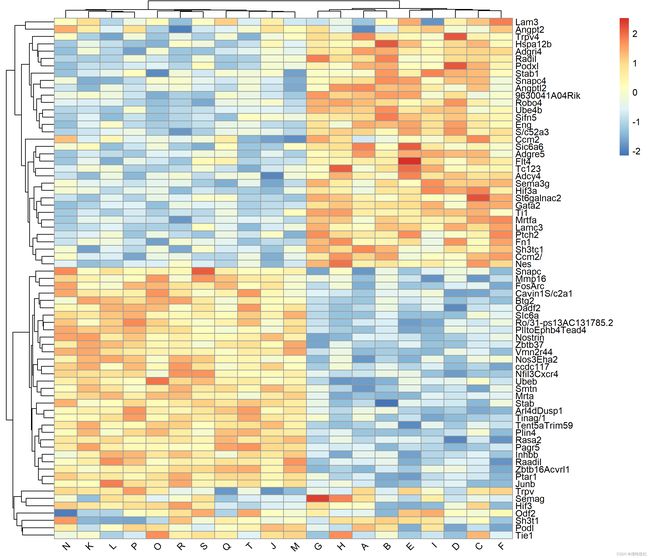
2、设置颜色
rm(list=ls())#clear Global Environment
setwd('D:/Desktop/0000/code-main/热图')#设置工作路径

#加载R包
library (pheatmap)
#读取数据
df <- read.table(file="data.txt",sep="\t",row.names = 1, header=T,check.names=FALSE)
#查看前3行
head(df)[1:5,]
####Z-score转换以保留数据的真实差异
df1 <-df[apply(df,1,var)!=0,]  ##去掉方差为0的行,也就是值全都一致的行
df_zscore <-as.data.frame(t(apply(df1,1,scale)))#标准化数据,获得Z-score
colnames(df_zscore)<- colnames(df)
#设置颜色
pheatmap(df_zscore,
         angle_col = "45",
         cellwidth=25, cellheight=8,
         treeheight_col = 15,
         color=colorRampPalette(c("#3952a2","black","#f5ea14"))(100),
         filename = "heatmap.png")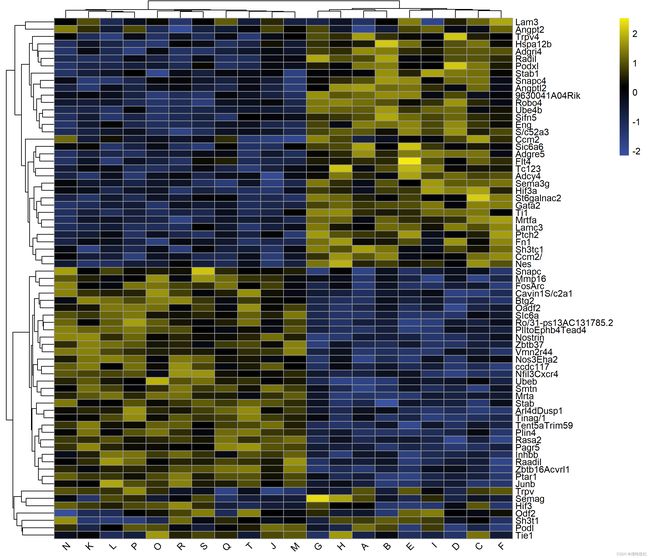
3、添加行注释信息
rm(list=ls())#clear Global Environment
setwd('D:/Desktop/0000/code-main/热图')#设置工作路径

#加载R包
library (pheatmap)
#读取数据
df <- read.table(file="data.txt",sep="\t",row.names = 1, header=T,check.names=FALSE)
#查看前3行
head(df)[1:5,]
####Z-score转换以保留数据的真实差异
df1 <-df[apply(df,1,var)!=0,]  ##去掉方差为0的行,也就是值全都一致的行
df_zscore <-as.data.frame(t(apply(df1,1,scale)))#标准化数据,获得Z-score
colnames(df_zscore)<- colnames(df)

#添加行注释信息
annotation_col<- data.frame( "Treatment" = c("Saline","Saline","Saline","Cocaine","Saline",
                                             "LSD","LSD","LSD","LSD","Saline",
                                             "Saline","Saline","MDMA","MDMA","MDMA",
                                             "Ketamine","Ketamine","Ketamine","Ketamine","Ketamine"),
                             "Batch" = c("1","1","1","1","2",
                                         "1","2","3","2","1",
                                         "2","2","2","1","2",
                                         "1","3","3","3","3"),
                             "Post_treatment" = c("48 h","2 wk","2 wk","48 h","48 h",
                                                  "48 h","2 wk","48 h","48 h","2 wk",
                                                  "48 h","2 wk","2 wk","2 wk","2 wk",
                                                  "2 wk","48 h","48 h","48 h","48 h"),
                             "Critical_period" = c("Closed","Closed","Closed","Closed","Closed",
                                                   "Closed","Closed","Closed","Closed","Open",
                                                   "Open","Open","Open","Open","Open",
                                                   "Open","Open","Open","Open","Open"))#行注释矩阵
rownames(annotation_col) = colnames(df_zscore)
colors  <-  list("Treatment" = c(Saline = "#000000", Cocaine = "#575757",LSD = "#e79600",MDMA="#a42422",Ketamine="#c53a8e"),
                 "Batch" = c( "1"= "#3953a3", "2" = "#ef4a4a", "3" = "#009848"),
                 "Post_treatment" = c("48 h"="#64838c","2 wk"="#2c3a3e"),
                 "Critical_period" = c(Closed="#94c83d",Open="#4e2469"))
pheatmap(df_zscore,
         angle_col = "45",
         cellwidth=25, cellheight=8,
         treeheight_col = 15,
         color=colorRampPalette(c("#3952a2","black","#f5ea14"))(100),
         annotation_col = annotation_col,
         annotation_colors = colors,
         show_colnames = F,
         filename = "heatmap.png")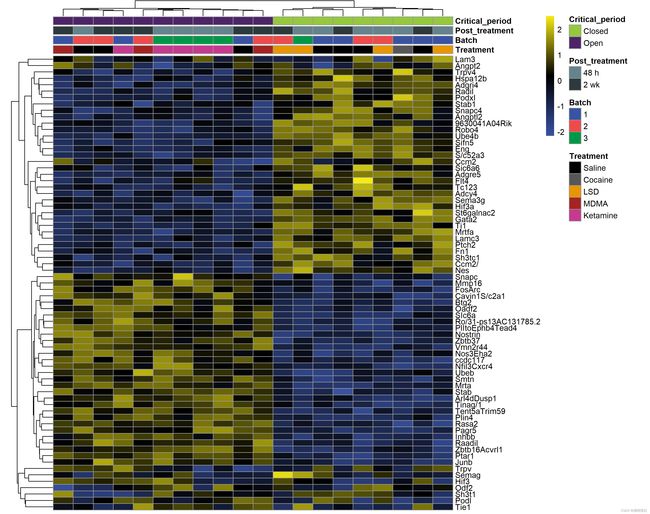
4、美化(通过调节细节参数以及结合AI进行美化)
rm(list=ls())#clear Global Environment
setwd('D:/Desktop/0000/code-main/热图')#设置工作路径

#加载R包
library (pheatmap)
#读取数据
df <- read.table(file="data.txt",sep="\t",row.names = 1, header=T,check.names=FALSE)
#查看前3行
head(df)[1:5,]
####Z-score转换以保留数据的真实差异
df1 <-df[apply(df,1,var)!=0,]  ##去掉方差为0的行,也就是值全都一致的行
df_zscore <-as.data.frame(t(apply(df1,1,scale)))#标准化数据,获得Z-score
colnames(df_zscore)<- colnames(df)

#添加行注释信息
annotation_col<- data.frame( "Treatment" = c("Saline","Saline","Saline","Cocaine","Saline",
                                             "LSD","LSD","LSD","LSD","Saline",
                                             "Saline","Saline","MDMA","MDMA","MDMA",
                                             "Ketamine","Ketamine","Ketamine","Ketamine","Ketamine"),
                             "Batch" = c("1","1","1","1","2",
                                         "1","2","3","2","1",
                                         "2","2","2","1","2",
                                         "1","3","3","3","3"),
                             "Post_treatment" = c("48 h","2 wk","2 wk","48 h","48 h",
                                                  "48 h","2 wk","48 h","48 h","2 wk",
                                                  "48 h","2 wk","2 wk","2 wk","2 wk",
                                                  "2 wk","48 h","48 h","48 h","48 h"),
                             "Critical_period" = c("Closed","Closed","Closed","Closed","Closed",
                                                   "Closed","Closed","Closed","Closed","Open",
                                                   "Open","Open","Open","Open","Open",
                                                   "Open","Open","Open","Open","Open"))#行注释矩阵
rownames(annotation_col) = colnames(df_zscore)
colors  <-  list("Treatment" = c(Saline = "#000000", Cocaine = "#575757",LSD = "#e79600",MDMA="#a42422",Ketamine="#c53a8e"),
                 "Batch" = c( "1"= "#3953a3", "2" = "#ef4a4a", "3" = "#009848"),
                 "Post_treatment" = c("48 h"="#64838c","2 wk"="#2c3a3e"),
                 "Critical_period" = c(Closed="#94c83d",Open="#4e2469"))
###美化
pheatmap(df_zscore,
         angle_col = "45",
         cellwidth=25, cellheight=8,
         treeheight_col = 15,
         color=colorRampPalette(c("#3952a2","black","#f5ea14"))(100),
         annotation_col = annotation_col,
         annotation_colors = colors,
         show_colnames = F,
         fontsize_row=9, fontsize=12,
         labels_row = as.expression(lapply(rownames(df_zscore),function(x) bquote(italic(.(x))))),#行名斜体
         filename = "heatmap.png")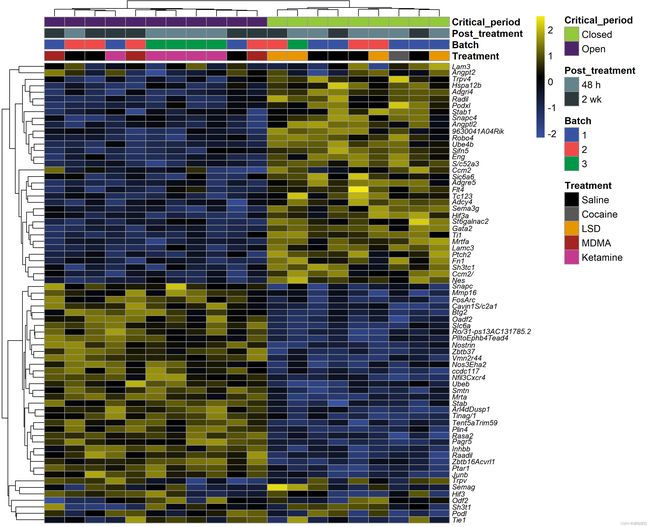
5、数据
热图.zip - 蓝奏云