import matplotlib.pyplot as plt
import numpy as np
srcpath=r'C:\Users\user\Documents\F1-21\data0.125-1.8.txt'
def openreadtxt(file_name):
data = []
with open(file_name, 'r') as file:
file_data = file.readlines() # 读取所有行
for row in file_data:
tmp_list = row.split()
tmp = [float(x) for x in tmp_list]
data.append(tmp) # 将每行数据插入data中
return data
if __name__ == "__main__":
data=openreadtxt(srcpath)
data_T1=data[0:9]
data_T2=data[9:]
xs=np.linspace(0.02,0.32,16)
fig=plt.figure(figsize=(5,4))
plt.rcParams['xtick.direction'] = 'in' # 将x周的刻度线方向设置向内
plt.rcParams['ytick.direction'] = 'in' # 将y轴的刻度方向设置向内
# plt.rcParams['font.family'] = ["Times New Roman"] # 字体设置为Times NewRoman
plt.rcParams['font.sans-serif'] = ['SimHei']
clist = ['blue', 'red', 'green', 'black', 'darkgreen', 'lime', 'gold', 'purple', 'green', 'cyan', 'salmon', 'grey',
'mediumvioletred', 'darkkhaki', 'gray', 'darkcyan', 'violet', 'powderblue']
markerlst = ['o', '*', 'x', '>', '<', '^', 'D', 'd', '1', '2', '3', '4', 'o', '*', 'x', '>', '<', '^', 'D', 'd',
'1', '2', '3', '4', 'o', '*', 'x', '>', '<', '^', 'D', 'd', '1', '2', '3', '4']
linestylelst = ['-', '--', '-.', ':', '-', '--', '-.', ':', '-', '--', '-.', ':', '-', '--', '-.', ':', '-', '--',
'-.', ':', '-', '--', '-.', ':']
for i in range(len(data_T1)):
plt.plot(xs[2:],data_T1[i][2:],c=clist[1], marker=markerlst[i], markersize='10', linewidth='3', linestyle=linestylelst[1], label=f'T1-{i+1}')
for i in range(len(data_T2)):
if i==4 or i==3:
continue
plt.plot(xs[2:], data_T2[i][2:], c=clist[2], marker=markerlst[i], markersize='10', linewidth='3', linestyle=linestylelst[1], label=f'T2-{i+1}')
font1 = {'family': 'SimHei', 'weight': 'normal', 'size': 16}
# 图例展示位置,数字代表第几象限
plt.legend(loc=4,prop=font1,ncol=4,framealpha=0.5)
plt.xticks(xs[2:])
plt.yticks(np.linspace(0.124,0.132,9))
plt.grid(True, linestyle='--', alpha=0.5)
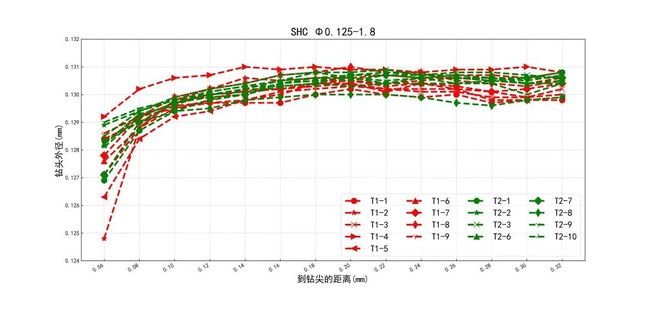
plt.xlabel("到钻尖的距离(mm)", fontdict={'size': 16})
plt.ylabel("钻头外径(mm)", fontdict={'size': 16})
plt.title("SHC Φ0.125-1.8", fontdict={'size': 20})
fig.autofmt_xdate()
plt.show()
figure1 = fig.get_figure() # 获取图形
figure1.savefig("C:\\Users\\user\\Documents\\1.jpg", dpi=300)