蒙特卡洛方法的数学基础-1
- 蒙特卡洛方法的数学基础-1
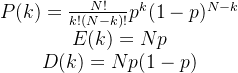
概率论
Bayes 公式
![]()
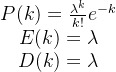
常用分布
Binominal Distribution
Poisson Distribution
Gaussian Distribution ![]()
![]()
![]()
Exponential Distribution
![]()
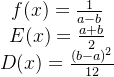
Uniform Distribution
大数定理
- 均匀概率分布随机地取N个数xi ,函数值之和的算术平均收敛于函数的期望值
-
算术平均收敛于真值
![]()
中心极限定理
-
n个相互独立分布各异的随机变量的 总和服从正态分布
-
置信水平下的统计误差
![]()
![]()
Monte Carlo方法简单应用
案例:Buffon 投针实验
- 略
案例:投点法求定积分
- 略
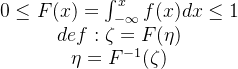
任意分布的伪随机变量的抽样
反函数直接抽样法
变换抽样法
dim=1
![]()
dim=2
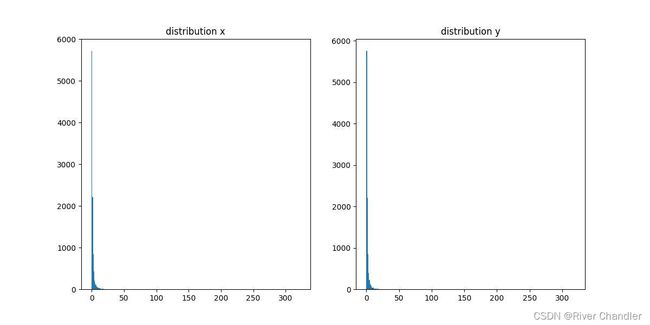
改进的Maraglia方法
import numpy as np
import matplotlib.pyplot as plt

np.random.seed(0)

Num = 10000
x = np.zeros(Num)
y = np.zeros(Num)
z = np.zeros(Num)

Times = 0
while Times < Num:
    u,v = np.random.rand(2)
    w = (2*u-1)**2 + (2*v-1)**2
    if w<=1:
        z[Times] = (-2*np.log(w)/w)**0.5
        x[Times] = u * z[Times]
        y[Times] = v * z[Times]
        Times += 1
    else:
        continue

fig = plt.figure(figsize=(12, 6))
ax1 = fig.add_subplot(1, 2, 1)
ax2 = fig.add_subplot(1, 2, 2)

ax1.hist(x, np.arange(0, max(x), 1))
ax1.set_title("distribution x")

ax2.hist(y, np.arange(0, max(y), 1))
ax2.set_title("distribution y")

plt.savefig("3.jpg")
舍选抽样法
...
复合抽样法
![]()
- 依据概率密度函数
 抽样
抽样
- 依然条件概率密度函数
 抽样
抽样
![]()
加分布与减分布抽样法
- 加分布抽样
![]() 其中
其中![]()
- 取\zeta \sim U[0,1],解对n的不等式
![]()
- 对,对应的hn(x) 抽样得 \zeta = \zeta_{h_n}
- 减分布抽样
乘加与乘减分布抽样法
...
反函数近似抽样法
近似替代![]()
最小二乘拟合 ![]()
极限近似法
...
蒙特卡洛方法处理定积分
近似积分公式
-
近似积分公式在某种意义上是对区间内某些函数值的加权平均
-
蒙卡方法的目的是优化样本点的选择(位置和权重)
-
- 矩形积分方法
 (The Leftpoint Rule)
- 1阶近似
- 矩形积分方法
 (The Rightpoint Rule)
- 1阶近似
- 矩形积分方法
 (The Midpoint Rule)
- 2阶近似
- 梯形积分方法
 (The Trapezoidal Rule)
- 2阶近似
- Simpson's Rule
![\int_\alpha^\beta f(x)dx \approx \frac{\beta-\alpha}{6}[f(\alpha)+4f(\frac{\alpha+\beta}{2})+f(\beta)]](http://img.e-com-net.com/image/info8/d8457c2a9c294c6b8b8945ca61147ead.png)
- 4阶近似
蒙特卡洛积分思路
- iid
- independent and identically distributed
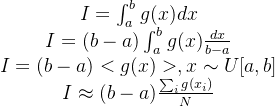
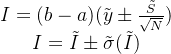
- example
![]()
import matplotlib.pyplot as plt
import numpy as np
import scipy.integrate as integrate

np.random.seed(0)
a = 0
b = 5
N = 100000

f = lambda x:x**2 + np.exp(x)
result1 = integrate.quad(f, a, b)

points = np.random.rand(N)*(b-a) + a
ybar = sum(f(points))/N
Sbar = (sum((points-ybar)**2)/N)**0.5
result2 = ((b-a)*ybar, (b-a)*Sbar/N**0.5)

X = np.linspace(a, b, N+1)
result3 = f(X[0]) + f(X[N])
flag = 1
for i in range(1, N-1):
    if flag == 1:
        result3 += 4*f(X[i])
        flag *= -1

    elif flag == -1:
        result3 += 2*f(X[i])
        flag *= -1

    else:
        print("ERROR!")

result3 *= (b-a)/N/3

print("result1:", result1)
print("result2:", result2)
print("result3:", result3)
result1: (189.07982576924329, 2.099207760611269e-12)
result2: (188.98624801068067, 0.5586055984291508)
result3: 189.06826542000084
>>>
- 如何评价哩,只能说,蒙卡方法至少能积出正确的答案,关键是速度慢啊
- 好吧,有人说是代码写得差,嗯 合理
- 改一下
import matplotlib.pyplot as plt
import numpy as np
import scipy.integrate as integrate

np.random.seed(0)
a = 0
b = 5
N = 100000

f = lambda x:x**2 + np.exp(x)
result1 = integrate.quad(f, a, b)

points = np.random.rand(N)*(b-a) + a
ybar = sum(f(points))/N
Sbar = (sum((points-ybar)**2)/N)**0.5
result2 = ((b-a)*ybar, (b-a)*Sbar/N**0.5)

X = np.linspace(a, b, N+1)
result3 = f(X)
coeff = np.ones(N+1)
coeff[1::2] = 4
coeff[2::2] = 2
result3 *= coeff
result3 = sum(result3)


result3 *= (b-a)/N/3

print("result1:", result1)
print("result2:", result2)
print("result3:", result3)
- 测一下用时吧,时间复杂度都是同阶的(大误,这是Python的numpy 特性)
import matplotlib.pyplot as plt
import numpy as np
import scipy.integrate as integrate
import time

np.random.seed(0)
a = 0
b = 5
N = 100000

f = lambda x:x**2 + np.exp(x)
s1 = time.time()
for i in range(100):
    result1 = integrate.quad(f, a, b)
e1 = time.time()

s2 = time.time()
for i in range(100):
    points = np.random.rand(N)*(b-a) + a
    ybar = sum(f(points))/N
    Sbar = (sum((points-ybar)**2)/N)**0.5
    result2 = ((b-a)*ybar, (b-a)*Sbar/N**0.5)
e2 = time.time()

X = np.linspace(a, b, N+1)
coeff = np.ones(N+1)
coeff[1::2] = 4
coeff[2::2] = 2
s3 = time.time()
for i in range(100):
    result3 = f(X)
    result3 *= coeff
    result3 = sum(result3)
    result3 *= (b-a)/N/3
e3 = time.time()

print("result1:", result1, "used time:", round(e1 - s1, 2))
print("result2:", result2, "used time:", round(e2 - s2, 2))
print("result3:", result3, "used time:", round(e3 - s3, 2))
result1: (189.07982576924329, 2.099207760611269e-12) used time: 0.0
result2: (188.83626394308098, 0.5580722224407848) used time: 1.8
result3: 189.0827159885614 used time: 0.9
>>>
- 蒙卡在这里,精度低,速度慢......