数据大清洗_Pyecharts 可视化(安装Pyecharts )(Pyecharts 图表绘制)
目录
- 一、Pyecharts 认识
-
- (一)对 Pyecharts 认识
- (二)安装:
- 二、Pyecharts 图表绘制
-
- (一)Pyecharts 绘制图表理解
-
- 1、全局配置项
- 2、系列配置项
- 3、注意:数据格式
- (二)图表绘制
-
- 1、柱状图
- 2、饼图
- 3、玫瑰图
- 4、折线图与柱状图组合
一、Pyecharts 认识
(一)对 Pyecharts 认识
Pyecharts 是一个用于生成 Echarts 图表的类库。
Echarts 是百度开源的一个数据可视化 JS 库,主要用于数据可视化。Pyecharts 是一个用于生成 Echarts 图表的类库。实际上就是 Echarts 与 Python 的对接。
使用 Pyecharts 可以生成独立的网页,也可以在 flask , Django 中集成使用。
(二)安装:
安装方式:pip install pyecharts==1.5
验证成功:

二、Pyecharts 图表绘制
(一)Pyecharts 绘制图表理解
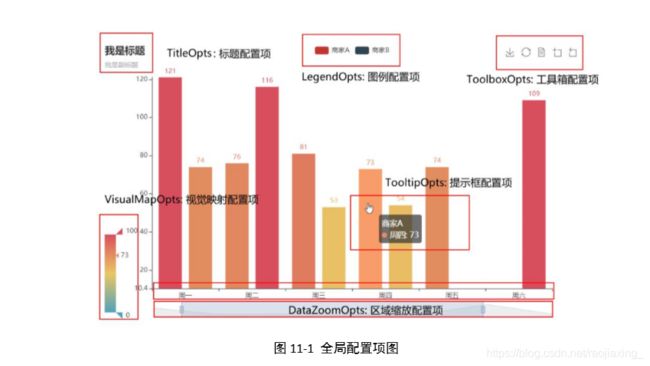
1、全局配置项
全局配置项可通过 set_global_options 方法设置。
2、系列配置项
可以使用 set_series_options 方法设置
主要用来配置用来配置字体、颜色、线条灯具体的参数。
3、注意:数据格式
Pyecharts 本质上在做的事情就是将Echarts 的配置项由 Python dict 序列化为JSON 格式,所以 Pyecharts 支持什么格式的数据类型取决于 JSON 支持什么数据类型。
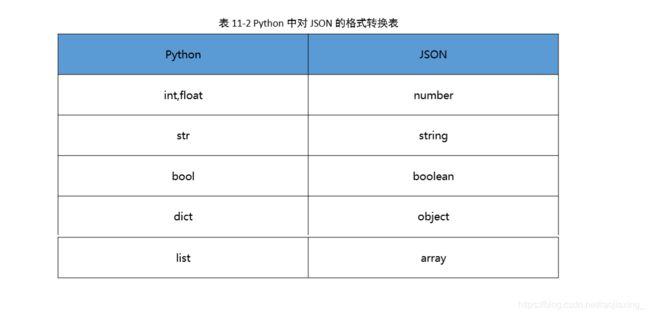
具体转换方式:
可以使用 Series.tolist()进行快速转换。
(二)图表绘制
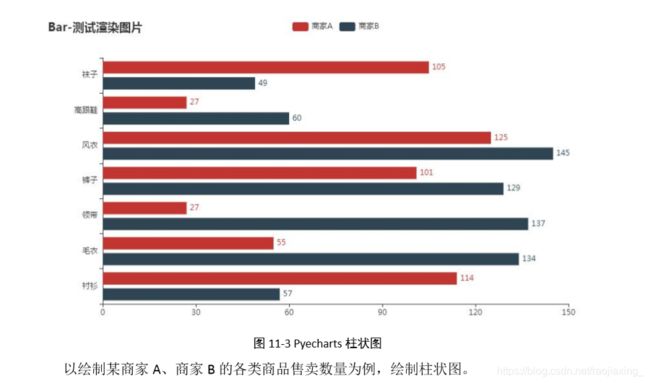
1、柱状图
# 导入配置项
from pyecharts import options as opts
# 导入柱状图的绘制API
from pyecharts.charts import Bar

import numpy as np

from pyecharts.globals import ThemeType


# 定义一个 bar_chart
def bar_chart() -> Bar:
    """
    柱状图绘制
    :return:
    """
    # add_xaxis : 增加横轴,内容为一个序列
    # add_yaxis : 增加纵轴值
    # reversal_axis : 使轴进行翻转--->即让柱子水平方式
    # set_global_opts :全局设置
    # set_series_opts : 系列设置
    c = (Bar(
        # 初始化配置---实例化对象时候配置
        init_opts=opts.InitOpts(page_title='两个商家的销售对比柱状图',  # 网页名称
                                theme='while',  # 图表主题
                                bg_color='#90EE90',  # 背景颜色
                                ),
    ) \
        .add_xaxis(
            xaxis_data=['衬衫', '毛衣', '领带', '裤子', '风衣', '高跟鞋', '袜子']) \
        .add_yaxis(
            series_name='商家A',  # 这一类柱子的 名称
            yaxis_data=[114, 55, 27, 101, 125, 27, 105]  # 商家A 对应的各个品牌的值
        ).add_yaxis(
            series_name='商家B',  # 这一类柱子的名称
            yaxis_data=[57, 134, 137, 129, 145, 60, 49]
        )). \
        reversal_axis(). \
        set_global_opts(
            title_opts=opts.TitleOpts(title='Bar图绘制'),
        ).set_series_opts(
            label_opts=opts.LabelOpts(position='right')
    )

    return c


bar_chart().render('./柱状图绘制.html')
2、饼图
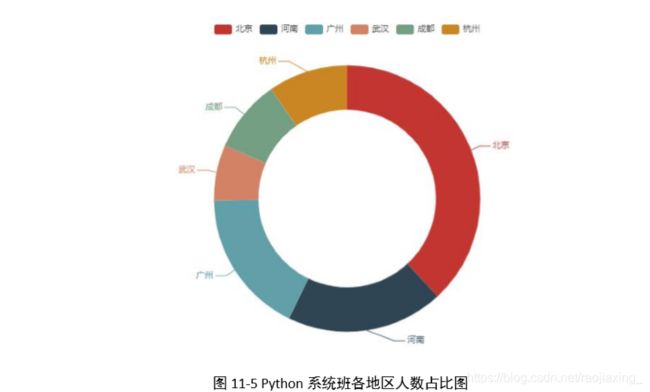
以各个地区分校的 Python 系统班人数统计数据为例,绘制饼图。
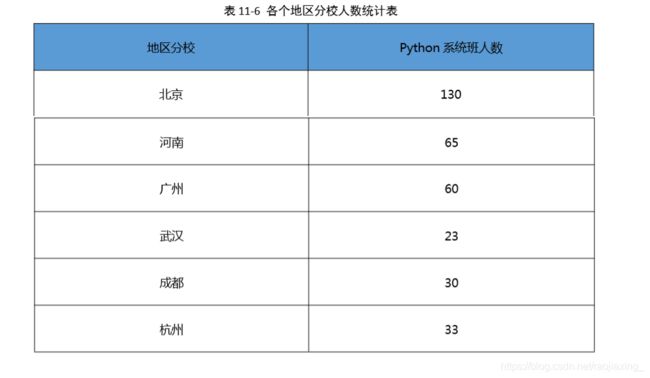
代码实现:
# 导入配置模块
from pyecharts import options as opts
# 导入饼图绘制模块
from pyecharts.charts import Pie

import pandas as pd

# 加载数据
data = pd.read_excel('./Python地区分校人数.xlsx')
print('data:\n', data)
print('data:\n', data.values.tolist())

# # 绘制饼图
pie = Pie(
    init_opts=opts.InitOpts(bg_color='#F0E68C')
)
#
# # 对pie对象进行增加数据
pie.add(
    series_name='分校人数',
    data_pair=data.values.tolist(),  # types.Sequence --->格式为:[(key1, value1), (key2, value2)]
    radius=['50%', '75%'],  # 第一个元素为内径半径,第二个元素为外径的半径
)

# 添加全局配置
pie.set_global_opts(
    title_opts=opts.TitleOpts(title='Python系统班地区人数占比图',
                              pos_left='center'),
    legend_opts=opts.LegendOpts(is_show=False),
)

# 添加系列配置
pie.set_series_opts(
    label_opts=opts.LabelOpts(is_show=True,
                              color='#8FBC8F',
                              font_size=15,
                              )
)

# 生成html
pie.render('./Python系统班地区人数占比图.html')
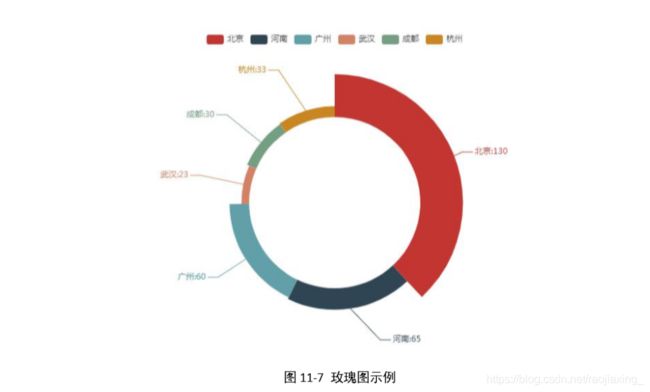
3、玫瑰图
# 导入配置模块
from pyecharts import options as opts

# 导入饼图绘制模块
from pyecharts.charts import Pie

# 导入pandas
import pandas as pd

# 导入主题模块
from pyecharts.globals import ThemeType

# 加载数据
data = pd.read_excel('./Python地区分校人数.xlsx')
print('data:\n', data)

# 绘制玫瑰图
# a、实例化对象
pie = Pie(
    init_opts=opts.InitOpts(bg_color='#F0E68C',
                            theme=ThemeType.DARK,
                            page_title='Python地区分校人数'
                            )
)

# b、增加数据
# # 对pie对象进行增加数据
pie.add(
    series_name='分校人数',
    data_pair=data.values.tolist(),  # types.Sequence --->格式为:[(key1, value1), (key2, value2)]
    radius=['50%', '75%'],  # 第一个元素为内径半径,第二个元素为外径的半径,
    rosetype='radius',  # 玫瑰图类型
)

# c、增加全局配置
pie.set_global_opts(
    title_opts=opts.TitleOpts(title='Python地区分校占比玫瑰图',
                              pos_left='center'
                              ),
    legend_opts=opts.LegendOpts(is_show=False)
)

# d、增加系列配置
pie.set_series_opts(
    label_opts=opts.LabelOpts(is_show=True,  # 展示标签
                              color='#8FBC8F',  # 标签颜色
                              font_size=15,  # 标签大小
                              formatter='{b}:{c}',  # {b} 代表数据项名称, {c}数据项的值 {d}数据项所占的比例
                              )
)

# 生成html
pie.render('./Python地区分校占比玫瑰图.html')
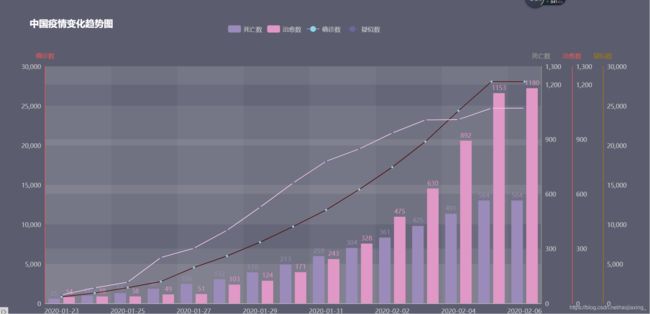
4、折线图与柱状图组合
# 导包 配置模块
from pyecharts import options as opts
# 导入主题模块
from pyecharts.globals import ThemeType
# 导入pandas
import pandas as pd
# 导入绘制柱状图、折线图模块
from pyecharts.charts import *

# 加载数据
history_data = pd.read_excel('./疫情历史数据.xls')
print('history_data:\n', history_data)
print('history_data:\n', history_data.dtypes)

# 准备横轴数据
# pyechart 不支持 其他类型 --->int、float、bool、dict、str、list
# 将时间列转化为字符串
history_data.loc[:, '时间'] = history_data.loc[:, '时间'].astype('str')
# print(history_data.loc[:,'时间'])
x_data = history_data.loc[:, '时间'][::-1].values.tolist()

print('x_data:\n', x_data)

# 准备纵轴数据
# 死亡人数
death_num = history_data.loc[:, '死亡数'][::-1].values.tolist()
print('death_num:\n', death_num)
# 确诊人数
ensue_num = history_data.loc[:, '确诊数'][::-1].values.tolist()
print('ensue_num:\n', ensue_num)
# 治愈人数
crued_num = history_data.loc[:, '治愈数'][::-1].values.tolist()
print('crued_num:\n', crued_num)
# 疑似人数
suspect_num = history_data.loc[:, '疑似数'][::-1].values.tolist()
print('suspect_num:\n', suspect_num)

# 使用bar来绘制死亡数和治愈 数
# a、实例化bar对象
bar = Bar()

# b、添加数据
# 增加横轴数据
bar.add_xaxis(x_data)
# 增加纵轴数据
# 死亡人数
bar.add_yaxis(
    series_name='死亡数',
    yaxis_data=death_num,
    color='#a5a391',  # 颜色
    yaxis_index=1,  # 最后多个纵轴时的 纵轴选择
)

# 治愈人数
bar.add_yaxis(
    series_name='治愈数',
    yaxis_data=crued_num,
    color="#fd5956",  # 颜色
    yaxis_index=2,  # 使用的y轴的 index,在单个图表实例中存在多个y轴的时候有用。
)

# 添加 额外的 坐标轴
bar.extend_axis(
    # 对 新增的 纵轴进行配置
    yaxis=opts.AxisOpts(
        type_='value',  # value 代表数据轴, 'category'代表类目轴,'time'代表时间轴
        name='死亡数',  # 轴的名称
        is_show=True,  # 展示该轴
        min_=0,  # 轴刻度的最小值
        max_=1300,  # 轴刻度的最大值
        position='right',  # 位置
        # 轴线配置
        axisline_opts=opts.AxisLineOpts(
            is_show=True,  # 显示轴线
            # 轴线的风格
            linestyle_opts=opts.LineStyleOpts(
                color='#a5a391'
            )
        ),
        # 轴线对应的标签 ---{value} ---数据
        axislabel_opts=opts.LabelOpts(
            formatter='{value}'
        )
    )
)
bar.extend_axis(
    # 对 新增的 纵轴进行配置
    yaxis=opts.AxisOpts(
        type_='value',  # value 代表数据轴, 'category'代表类目轴,'time'代表时间轴
        name='治愈数',  # 轴的名称
        is_show=True,  # 展示该轴
        min_=0,  # 轴刻度的最小值
        max_=1300,  # 轴刻度的最大值
        position='right',  # 位置
        offset=60,  # 偏离标准位置
        # 轴线配置
        axisline_opts=opts.AxisLineOpts(
            is_show=True,  # 显示轴线
            # 轴线的风格
            linestyle_opts=opts.LineStyleOpts(
                color='#fd5956'
            )
        ),
        # 轴线对应的标签 ---{value} ---数据
        axislabel_opts=opts.LabelOpts(
            formatter='{value}'
        )
    )
)

bar.extend_axis(
    yaxis=opts.AxisOpts(
        type_='value',
        name='疑似数',
        position='right',
        offset=120,
        min_=0,
        max_=30000,
        # 轴线配置
        axisline_opts=opts.AxisLineOpts(
            is_show=True,  # 显示轴线
            # 轴线的风格
            linestyle_opts=opts.LineStyleOpts(
                color='#ac7e04'
            )
        ),
        # 轴线对应的标签 ---{value} ---数据
        axislabel_opts=opts.LabelOpts(
            formatter='{value}'
        )
    )
)
# 添加全局配置
bar.set_global_opts(
    # 标题
    title_opts=opts.TitleOpts(
        title='中国疫情变化趋势图',
        pos_left='3%',  # title位置
        pos_top='5%',  # title位置
    ),
    # 图例
    legend_opts=opts.LegendOpts(
        pos_top='7%',  # 图例位置
        pos_left='25%',  # 图例位置
    ),
    # 提示框
    tooltip_opts=opts.TooltipOpts(
        trigger='axis',  # 'axis': 坐标轴触发,主要在柱状图,折线图等会使用类目轴的图表中使用
        axis_pointer_type='cross',  # 'cross':十字准星指示器。其实是种简写,表示启用两个正交的轴的 axisPointer。
    ),
    # 对纵轴的全局配置
    yaxis_opts=opts.AxisOpts(
        type_='value',
        name='确诊数',
        position='left',
        min_=0,
        max_=30000,
        # 轴线配置
        axisline_opts=opts.AxisLineOpts(
            is_show=True,  # 显示轴线
            # 轴线的风格
            linestyle_opts=opts.LineStyleOpts(
                color='#fd5956'
            )
        ),
        # 轴线对应的标签 ---{value} ---数据
        axislabel_opts=opts.LabelOpts(
            formatter='{value}'
        )
    ),

    # 插入文本框
    graphic_opts=opts.GraphicGroup(
        #  # 图形的配置项
        graphic_item=opts.GraphicItem(
            # 控制整体的位置
            left="75%",
            top="45%",
        ),
        children=[
            # # opts.GraphicRect控制方框的显示
            # # 如果不需要方框,去掉该段即可
            opts.GraphicRect(
                graphic_item=opts.GraphicItem(
                    z=100,  # z轴方向的显示位置
                    left="center",  # 左右位置
                    top="middle",  # 上下位置
                ),
                graphic_shape_opts=opts.GraphicShapeOpts(
                    width=420,  # 宽度
                    height=180,  # 高度
                ),
                graphic_basicstyle_opts=opts.GraphicBasicStyleOpts(
                    fill="#fff",  # 文本框填充颜色
                    stroke="#555",  # 笔画颜色
                    line_width=2,  # 宽度
                    shadow_blur=8,  # 阴影相关
                    shadow_offset_x=3,  # 阴影相关
                    shadow_offset_y=3,  # 阴影相关
                    shadow_color="rgba(0,0,0,0.3)",  # 阴影颜色
                )
            ),
            # 配置文本
            opts.GraphicText(
                # 配置文本的位置
                graphic_item=opts.GraphicItem(
                    left="center",
                    top='middle',
                    z=100,  # 显示位置
                    scale=[1.5, 1.5],  # 表示缩放
                ),
                graphic_textstyle_opts=opts.GraphicTextStyleOpts(
                    text="直到{},\n全国的新冠状肺炎病毒的相关信息为:\n死亡病例为{}例,\n治愈病例为{}例,\n确诊病例为{}例,\n疑似病例为{}例,专家呼吁:\n广大积极配置国家政策进行疫情防疫工作".format(
                        history_data.loc[0, '时间'],
                        history_data.loc[0, '死亡数'],
                        history_data.loc[0, '治愈数'],
                        history_data.loc[0, '确诊数'],
                        history_data.loc[0, '疑似数']),
                    font="15px Microsoft YaHei",  # 字体以及字体大小
                    text_align='left',  # 水平方向左对齐
                    text_vertical_align='middle',  # 垂直对齐方式 :默认None,
                    # 图形基本配置项:
                    graphic_basicstyle_opts=opts.GraphicBasicStyleOpts(
                        fill='#ffdf22',  # 颜色
                        line_width=1.2,  # 宽度

                    )
                )
            )
        ]
    )
)

# 添加系列配置
bar.set_series_opts(
    label_opts=opts.LabelOpts(is_show=True),  # 设置开启label
)

# 绘制折线图
# 绘制 确诊 折线图
line_ensure = Line()
# a、 添加数据
# 添加横轴数据
line_ensure.add_xaxis(x_data)
# 添加纵轴数据
line_ensure.add_yaxis(
    series_name='确诊数',
    y_axis=ensue_num,
    color="#4b0101",
    label_opts=opts.LabelOpts(is_show=False),
    # 线 配置
    linestyle_opts=opts.LineStyleOpts(
        width=1.2,
        color="#4b0101"
    )
)
# 绘制 疑似 折线图
line_suspect = Line()
# a、添加数据
# 添加横轴数据
line_suspect.add_xaxis(x_data)
# 添加纵轴数据
line_suspect.add_yaxis(
    series_name='疑似数',
    y_axis=suspect_num,
    color="#fed0fc",
    # 标签配置
    label_opts=opts.LabelOpts(is_show=False),
    # 线 配置
    linestyle_opts=opts.LineStyleOpts(
        width=1.2,
        color="#fed0fc"
    )
)

# 将 折线图 与 柱状图进行组合 --- Overlap
all_chart = bar.overlap(line_ensure).overlap(line_suspect)

# 组合
all_ = Grid(
    init_opts=opts.InitOpts(
        width="1750px",  # 宽度
        height='650px',  # 高度
        theme=ThemeType.PURPLE_PASSION,  # 主题
    )
)

all_.add(all_chart,
         grid_opts=opts.GridOpts(
             pos_top="20%",  # 位置
             pos_left="5%",  # 位置
             pos_right="40%"  # 位置
         ),
         is_control_axis_index=True,  # 控制索引
         )

# 生成html
all_.render('./疫情历史数据.html')

# 1、绘制2个柱状图  ---应该添加 3个新纵轴、 修改1个原来的纵轴(全局配置项)
# 2、绘制1个折线图
# 3、再绘制1个折线图
# 4、overlap 组合 ----层叠
# 5、控制 多个图表大小、主题 ---overlap组合多个图表 加入到 Grid组合
# 6、全局配置项里面---配置相关文本
