Echarts的自我学习记录
我这是黑马教学以及自己学习的记录
一、大屏可视化的布局问题
1、首先根据设计稿的尺寸来进行编写,视频内设计稿是1920,标准屏幕。
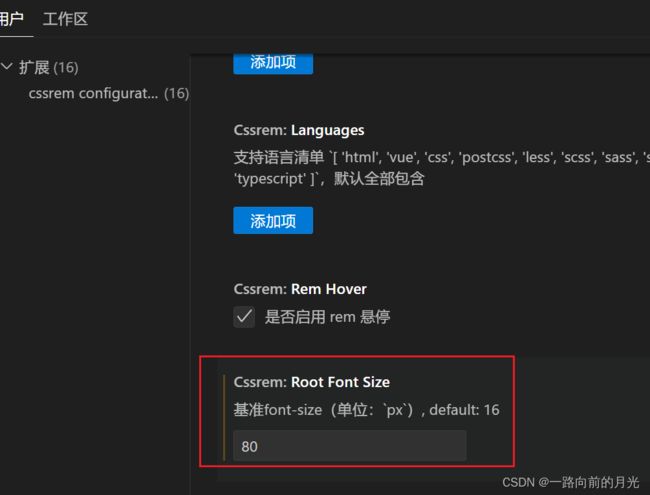
2、采用了flexible.js和px-to-rem
(function flexible(window, document) {
  var docEl = document.documentElement;
  var dpr = window.devicePixelRatio || 1;

  // adjust body font size
  function setBodyFontSize() {
    if (document.body) {
      document.body.style.fontSize = 12 * dpr + "px";
    } else {
      document.addEventListener("DOMContentLoaded", setBodyFontSize);
    }
  }
  setBodyFontSize();

  // set 1rem = viewWidth / 10
  function setRemUnit() {
    var rem = docEl.clientWidth / 24;
    docEl.style.fontSize = rem + "px";
  }

  setRemUnit();

  // reset rem unit on page resize
  window.addEventListener("resize", setRemUnit);
  window.addEventListener("pageshow", function(e) {
    if (e.persisted) {
      setRemUnit();
    }
  });

  // detect 0.5px supports
  if (dpr >= 2) {
    var fakeBody = document.createElement("body");
    var testElement = document.createElement("div");
    testElement.style.border = ".5px solid transparent";
    fakeBody.appendChild(testElement);
    docEl.appendChild(fakeBody);
    if (testElement.offsetHeight === 1) {
      docEl.classList.add("hairlines");
    }
    docEl.removeChild(fakeBody);
  }
})(window, document);
2、echarts
ECharts,一个使用 JavaScript 实现的开源可视化库,可以流畅的运行在 PC 和移动设备上,兼容当前绝大部分浏览器(IE8/9/10/11,Chrome,Firefox,Safari等),底层依赖矢量图形库 ZRender,提供直观,交互丰富,可高度个性化定制的数据可视化图表。
快速上手 - Handbook - Apache ECharts
引入页面四步走
第一步导入echarts,将相关插件引入页面
第二步 将这个图表放入一个具有大小和唯一标识的DOM容器中
var myChart = echarts.init(document.querySelector(".bar .chart"));
第三步 指定配置项和数据
 // 指定图表的配置项和数据
      var option = {
        title: {
          text: 'ECharts 入门示例'
        },
        tooltip: {},
        legend: {
          data: ['销量']
        },
        xAxis: {
          data: ['衬衫', '羊毛衫', '雪纺衫', '裤子', '高跟鞋', '袜子']
        },
        yAxis: {},
        series: [
          {
            name: '销量',
            type: 'bar',
            data: [5, 20, 36, 10, 10, 20]
          }
        ]
      };
第四步 将配置项设置给echarts实例
myChart.setOption(option);最后一步 适配问题
//  让图表跟随屏幕自动的去适应
        window.addEventListener("resize", function () {
          myChart.resize();
        });
opction实例中的属性
1、 grid决定我们的柱状图的大小
2、xAxis是控制x轴的各项设置
   // 设置x轴标签文字样式
  // x轴的文字颜色和大小
        axisLabel: {
          color: "rgba(255,255,255,.6)",
          fontSize: "12"
        },
   //  x轴样式不显示
   axisLine: {
       show: false
       // 如果想要设置单独的线条样式
       // lineStyle: {
       //    color: "rgba(255,255,255,.1)",
       //    width: 1,
       //    type: "solid"
      }
   }
3、y轴的相关配置 yAxis
yAxis: [
            {
              type: "value",
              // 修改刻度标签 相关样式
              axisLabel: {
                color: "rgba(255,255,255,.6) ",
                fontSize: 12,
              },
              // y轴的线条改为了 2像素
              axisLine: {
                lineStyle: {
                  color: "rgba(255,255,255,.1)",
                  width: 2,
                },
              },
              // y轴分割线的颜色
              splitLine: {
                lineStyle: {
                  color: "rgba(255,255,255,.1)",
                },
              },
            },
          ],
4、series是图表数据的控制属性
// 图标数据
    series: [{
      name:'新增粉丝',
      data:  [24, 40, 101, 134, 90, 230, 210, 230, 120, 230, 210, 120],
      type: 'line',
      smooth: true
    },{
      name:'新增游客',
      data: [40, 64, 191, 324, 290, 330, 310, 213, 180, 200, 180, 79],
      type: 'line',
      smooth: true
      }
    }]
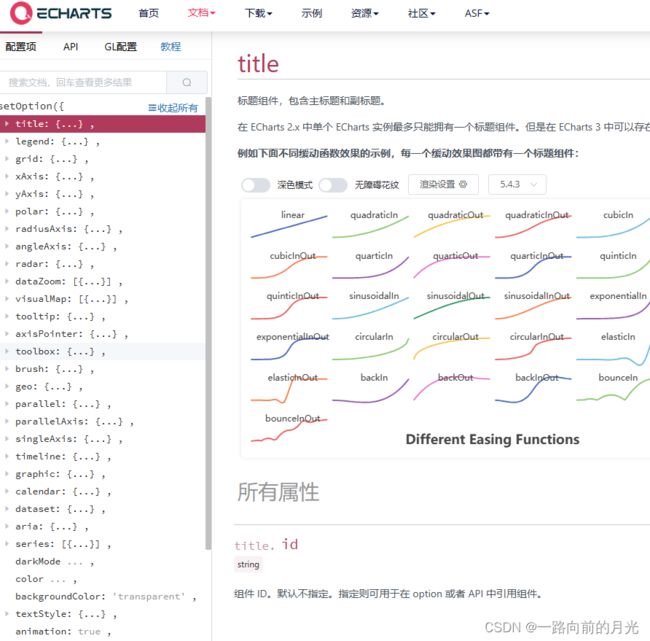
所有的配置项都可以在这找到
Documentation - Apache ECharts
完整代码
 (function () {
        // 1实例化对象
        var myChart = echarts.init(document.querySelector(".bar .chart"));
        // 2. 指定配置项和数据
        var option = {
          // 设置的是线条颜色
          color: ["pink"],
          // 图标提示框组件
          tooltip: {
            // 触发方式   axis坐标轴
            trigger: "axis",
            axisPointer: {
              // 坐标轴指示器,坐标轴触发有效
              type: "shadow", // 默认为直线,可选为:'line' | 'shadow'
            },
          },
          //网格配置 修改折线图 柱状图图表的大小
          grid: {
            left: "0%",
            top: "10px",
            right: "0%",
            bottom: "4%",
            // containLabel 刻度 坐标轴的刻度显示
            containLabel: true,
          },
          xAxis: [
            {
              type: "category",
              data: [
                "旅游行业",
                "教育培训",
                "游戏行业",
                "医疗行业",
                "电商行业",
                "社交行业",
                "金融行业",
              ],
              axisTick: {
                alignWithLabel: true,
              },
              // 修改刻度标签 相关样式
              axisLabel: {
                color: "rgba(255,255,255,.6) ",
                fontSize: "12",
              },
              // 不显示x坐标轴的样式
              axisLine: {
                show: false,
              },
            },
          ],
          yAxis: [
            {
              type: "value",
              // 修改刻度标签 相关样式
              axisLabel: {
                color: "rgba(255,255,255,.6) ",
                fontSize: 12,
              },
              // y轴的线条改为了 2像素
              axisLine: {
                lineStyle: {
                  color: "rgba(255,255,255,.1)",
                  width: 2,
                },
              },
              // y轴分割线的颜色
              splitLine: {
                lineStyle: {
                  color: "rgba(255,255,255,.1)",
                },
              },
            },
          ],
          series: [
            {
              name: "直接访问",
              type: "bar",
              barWidth: "35%",
              data: [200, 300, 300, 900, 1500, 1200, 600],
              itemStyle: {
                // 修改柱子圆角
                barBorderRadius: 5,
              },
            },
          ],
        };
        // 3. 把配置项给实例对象
        myChart.setOption(option);
        // 4. 让图表跟随屏幕自动的去适应
        window.addEventListener("resize", function () {
          myChart.resize();
        });
      })();
