博弈论:解决酒吧博弈问题
感觉自己写的一些问题(未解决):
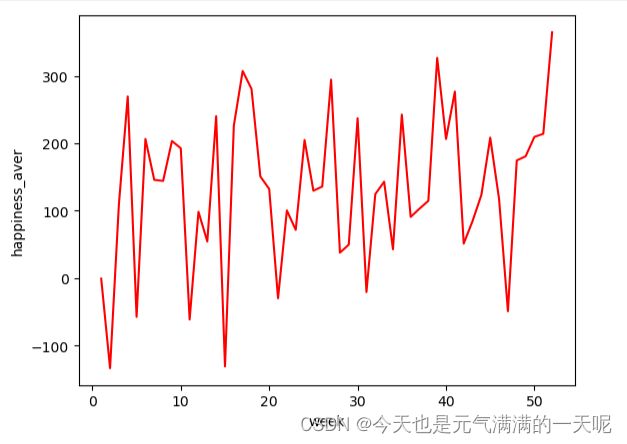
1.在设定关于幸福指数的标准里需要再进一步的修改(感觉起伏过大)。而且我是以每周的总居民幸福指数进行观测。
2.随机人数时一开始就非常接近60不知道是哪的问题(随机过很多次但是都没有出现一些比较小的值)。
一、实验内容
1.编程实现对酒吧博弈的模拟。
2.小镇居民的决策行为通过编写随机函数或实现简单的智能体来模拟。
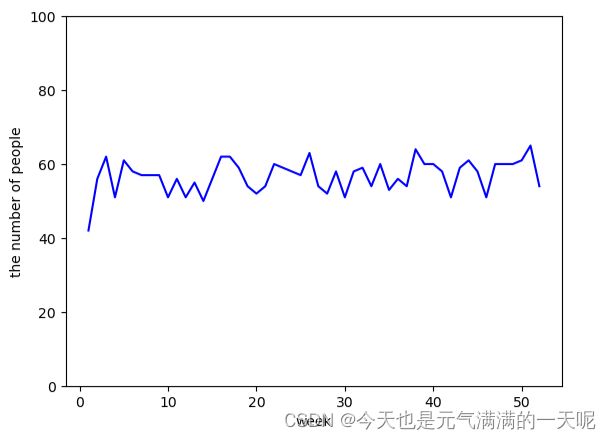
3.输出图表,展示模拟效果(一年内去酒吧人数,居民的平均幸福度等)。
4.分析结果,得出结论。
5.撰写设计说明书(包括程序的设计细节)写入实验报告。
6.将程序运行效果截图,粘贴到实验报告中。
二、实验步骤
1.读题:
本题是通过设计对居民去不去酒吧的决策行为进行预测。
2.体中未给出的信息有:
(1)由于居民去酒吧的概率未知。
所以规定:每个居民下周去酒吧的概率仅与上周的情况有关。
(2)关于幸福度的标准也没有制定
只会被“去不去酒吧”以及“没去酒吧后酒吧的服务”两个因素影响。
(3)设一年52周。
(4)第一周居民的决策完全随机
3.制定策略:
(1)关于居民去不去酒吧:
假设上周居民去了酒吧且去酒吧人数不足60人--享受了好的服务--下次去的概率增加5%;
假设上周居民去了酒吧且去酒吧人数超过60人--服务不好--下次去的概率减小5%;
假设上周居民没去酒吧且该周去酒吧人数不足60人--自身想去+听说服务好--下周去的概率增加10%;
假设第一周居民没去酒吧且该周去酒吧人数超过60人--听说服务不好--下周去的概率减少5%。
(2)关于居民幸福度:
居民去酒吧享受到好的服务--幸福度加10;
居民去酒吧没有享受到好的服务--幸福度减8;
居民没去酒吧且本周人数超过60人--幸福度加8;
居民没去酒吧且本周人数没超过60人--幸福度减10。
4.编写代码
(1)使用的库
import matplotlib.pyplot as plt
import random
(2)根据已有信息设置
people = 100 #人总数
weeks = 52#一年总周数
happiness_sum=[0]*weeks#一周的幸福度

go_to_bar = [0] * people#值为0或1,0表示不去酒吧,1表示去酒吧
people_go_to_bar = [0] * weeks #每周去酒吧的总人数
happiness_aver=[0]*weeks#每周幸福度
(3)第一周情况
#第一周完全随机
for i in range(people):
    if random.randint(0, 1) == 1:
        go_to_bar[i] = 1
#以下两个变量相当于中间变量
people_to_bar = 0
happiness=0
#第一周幸福度和第一周去的人数
for i in range(people):
    if go_to_bar[i] == 1:
        people_to_bar += 1
if people_to_bar<=60:
    for j in range(people):
        if go_to_bar[j]==1:
            happiness+=10
        else:
            happiness-=8
elif people_to_bat>60:
    for j in range(people):
        if go_to_bar[j]==1:
            happiness-=8
        else:
            happiness+=10
happiness_sum[0]=happiness
people_go_to_bar[0] = people_to_bar
print('第1周去酒吧的有:', people_to_bar)
(4)有概率的随机函数
'''一个函数:按照给定的概率,函数会以 n% 的概率得到1'''
def probability(n):
    if random.random() < n:
        return 1
    else:
        return 0
(5)后几周情况
# 后几周
for week in range(51):
    people_to_bar = 0
    happiness=0
    #以下代码是已制定的规则
    for i in range(people):
        if go_to_bar[i] == 1:
            if people_to_bar <= 60:
                n = 0.5 + 0.05
                happiness += 10
            elif people_to_bar > 60:
                n = 0.5 - 0.05
                happiness -= 8
        else:
            if people_to_bar <= 60:
                n = 0.5 + 0.1
                happiness-= 10
            elif people_to_bar > 60:
                n = 0.5 - 0.05
                happiness += 8
        #第一周后每周的幸福度和去酒吧人数
        happiness_sum[week+1]+=happiness
        people_go_to_bar[week + 1] = people_to_bar
        #对下周情况居民决策行为的预测
        go_to_bar[i] = probability(n)
        if go_to_bar[i] == 1:
            people_to_bar += 1
    print('第' + str(week + 2) + '周去酒吧的有:' + str(people_to_bar))
(6)平均幸福度
#平均每周幸福度
for k in range(weeks):
    happiness_aver[k]=happiness_sum[k]/weeks
(7)居民去酒吧情况折线图
#画图
weeks = list(range(1, weeks + 1))
plt.xlabel('week')
plt.ylabel('the number of people')
plt.ylim(0,100)
plt.plot(weeks, people_go_to_bar, c='b')
plt.show()
(8)幸福度情况折线图
plt.xlabel('week')
plt.ylabel('happiness_aver')
plt.plot(weeks,happiness_aver,c='r')
plt.show()
三、实验结果
1.每周人数:
第1周去酒吧的有: 42
第2周去酒吧的有:57
第3周去酒吧的有:63
第4周去酒吧的有:52
第5周去酒吧的有:62
第6周去酒吧的有:59
第7周去酒吧的有:58
第8周去酒吧的有:57
第9周去酒吧的有:58
第10周去酒吧的有:52
第11周去酒吧的有:57
第12周去酒吧的有:51
第13周去酒吧的有:56
第14周去酒吧的有:51
第15周去酒吧的有:56
第16周去酒吧的有:63
第17周去酒吧的有:63
第18周去酒吧的有:59
第19周去酒吧的有:55
第20周去酒吧的有:53
第21周去酒吧的有:55
第22周去酒吧的有:61
第23周去酒吧的有:59
第24周去酒吧的有:59
第25周去酒吧的有:58
第26周去酒吧的有:64
第27周去酒吧的有:54
第28周去酒吧的有:53
第29周去酒吧的有:59
第30周去酒吧的有:51
第31周去酒吧的有:58
第32周去酒吧的有:60
第33周去酒吧的有:55
第34周去酒吧的有:61
第35周去酒吧的有:54
第36周去酒吧的有:56
第37周去酒吧的有:54
第38周去酒吧的有:64
第39周去酒吧的有:60
第40周去酒吧的有:60
第41周去酒吧的有:58
第42周去酒吧的有:51
第43周去酒吧的有:60
第44周去酒吧的有:62
第45周去酒吧的有:59
第46周去酒吧的有:51
第47周去酒吧的有:61
第48周去酒吧的有:61
第49周去酒吧的有:61
第50周去酒吧的有:61
第51周去酒吧的有:65
第52周去酒吧的有:54
2.居民去不去折线图
3.幸福度折线图

