WebGL绘制带箭头的线
最近公司项目要求根据指定的经纬度绘制一个带箭头的线指向某个点
额外还提供了距离和角度
因为常用的技术栈为mapbox和leaflet,对比了一下两种的方法,还是选择mapbox来绘制该效果,其实leaflet也是跟mapbox相似,改一下对应的方法就行。
对于实现的第一反应是用图片,毕竟简单速度还很快,但是这个也是问题最多的一个情况,缩放级别比较小的情况下还是ok的,毕竟很多信息看不到,但是一旦放大,很多事情就暴露出来了。

第一个方法 - 使用图片绘制带箭头的线
this.map = new mapboxgl.Map({ /*自己配置*/})
// LineString类型的geojson
const markerLine = { type: 'FeatureCollection', features: []}
// 注册图片,{pointImg}位置放图片地址或者图片数据
this.map.loadImage(pointImg, (error, image) => {
if(error) throw error;
this.map.addImage('line-arrow', image)
})
this.map.addSource('markers-' + index, {
type: 'geojson',
data: markers
})
// 如果要绘制很多箭头的话,需要加上index,用来区分图层ID
this.map.addLayer({
id: 'line-arrow-' + index,
source: 'markers-' + index,
type: 'symbol',
minzoom: 6,
layout: {
'icon-image': 'line-arrow',
'symbol-placement': 'point',
'icon-anchor': 'bottom',
'icon-rotate': ['get', 'theta'], // 使用markerLine内properties下的theta,需要自己获取,或者计算
'icon-size': ['interpolate', ['linear'], ['zoom'], 12, .5, 18, 1.5] // 运算式-根据缩放调整对应的大小
}
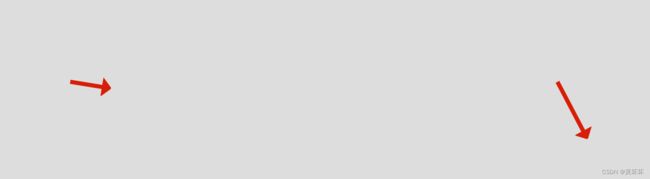
})当然了 缺点也是很明显,没有比较好的运用表达式的手段,他的长度是很难改变的,而且图片属于一个整体,没有办法单独修改它的长度和宽度,如下就是绘制的效果,可以看出长度都是一致的,毕竟图片吗

第二种方法 - 箭头使用图片,线段自行绘制
this.map = new mapboxgl.Map({ /*自己配置*/})

// 绘制线的两个经纬度
const markerLine = { type: 'FeatureCollection', features: []}
// 箭头放置的经纬度点
const endPoint = { type: 'FeatureCollection', features: []}

// 注册图片,{pointImg}位置放图片地址或者图片数据
this.map.loadImage(pointImg, (error, image) => {
    if(error) throw error;
    this.map.addImage('arrow-icon', image)
})

this.map.addSource('markerLine-' + index, {
	type: 'geojson',
	data: markerLine
})

// 绘制线条,加上index避免在绘制多个图层的时候ID冲突
this.map.addLayer({
    id: 'line-' + index,
    source: 'markerLine-' + index,
    type: 'line',
    minzoom: maxShow,
    paint: {
		'line-color': '#d81e06',
		'line-width': ['interpolate', ['linear'], ['zoom'], 9, 20, 20, 10]
	}
})
// 绘制箭头
this.map.addSource('endPoint-' + index, {
    type: 'geojson',
    data: endPoint
})
this.map.addLayer({
	id: 'arrow-' + index,
	source: 'endPoint-' + index,
	type: 'symbol',
	filter: ['!=', 'radius', 0],
	minzoom: maxShow,
	layout: {
		'icon-image': 'arrow-icon', // 配合上面的loadImage注册图片
		'icon-rotate': ['get', 'theta'],
		'icon-allow-overlap': true,
		'icon-size': ['interpolate', ['linear'], ['zoom'], 10, .1, 18, .3]
	}
})
这一种就比纯用图片可控多了,可以修改箭头和线段的长度和宽度,但是依然存在一定的问题,就是线非常短的情况下,头部的箭头并不会对应的进行调整,即一损俱损一荣俱荣。
第三种方式 - 不使用图片
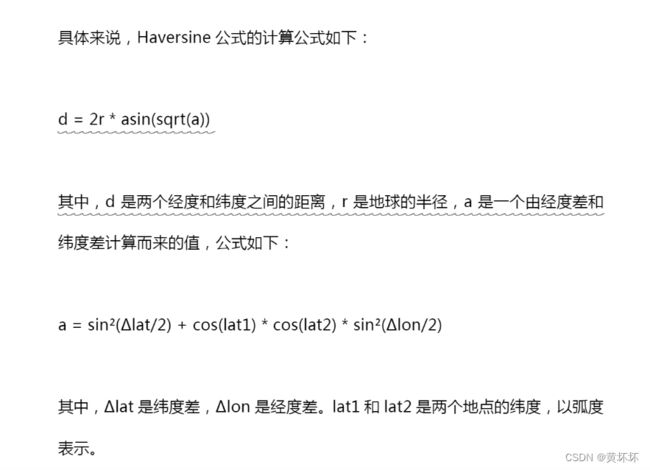
这一种方式 绘制线条还是如同之前的方法,不同的是箭头也是绘制的。而且在这个方法中需要使用Haversine公式来计算终点处的两个连接点。
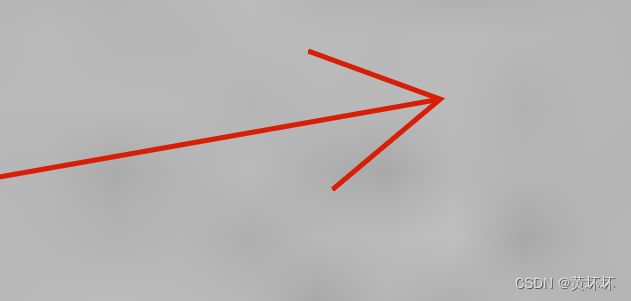
线头这部分主要是绘制两条线,根据指向点作为基准,向左旋转30°,向右旋转30°。就可以绘制箭头,可控性更好而且还可以指定长度和角度。如果想要箭头是填充的可以使用layer类型为fill绘制,我这里用的是线条类型的图层。
至于Haversine公式我从网上看到的大佬的公式 也放在下面了
this.map = new mapboxgl.Map({ /*自己配置*/})

// 绘制线的两个经纬度
const markerLine = { type: 'FeatureCollection', features: []}
// 箭头的lineString类型,也就是需要Haversine公式计算
const arrowLine = { type: 'FeatureCollection', features: []}

this.map.addSource('markerLine-' + index, {
	type: 'geojson',
	data: markerLine
})
this.map.addLayer({
	id: 'line-' + index,
	source: 'markerLine-' + index,
	type: 'line',
	paint: {
		'line-color': '#d81e06',
		'line-width': ['interpolate', ['linear'], ['zoom'], 9, 9, 20, 5] //  表达式 - 根据缩放调整线的宽度
	}
})
this.map.addSource('arrow-head-' + index, {
	type: 'geojson',
	data: arrowLine
})
this.map.addLayer({
	id: 'arrow-head-' + index,
	source: 'arrow-head-' + index,
	type: 'line', // 如果需要填充的三角箭头则换为fill
	paint: {
		'line-color': '#d81e06', // 如果需要填充的三角箭头则换为fill-color
		'line-width': ['interpolate', ['linear'], ['zoom'], 9, 9, 20, 5] //  // 如果需要填充的三角箭头则注释该行
	}
})
这个优点就是可控性好,而且可以自由设置样式。缺点则是需要用到算法,比较麻烦