vue在el-tab中使用echart(出现canvas高宽一直是100px问题+echart随外层div变化而自适应)
问题1:canvas高宽一直是100px问题
解决方法:使用v-if,参考文献https://blog.csdn.net/qq_42527726/article/details/106147539?utm_medium=distribute.pc_relevant.none-task-blog-2~default~baidujs_utm_term~default-0-106147539-blog-132323416.235^v38^pc_relevant_default_base&spm=1001.2101.3001.4242.1&utm_relevant_index=3
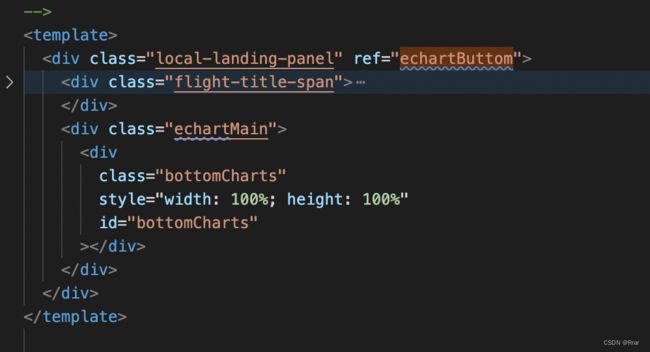
template部分:
	...


	...
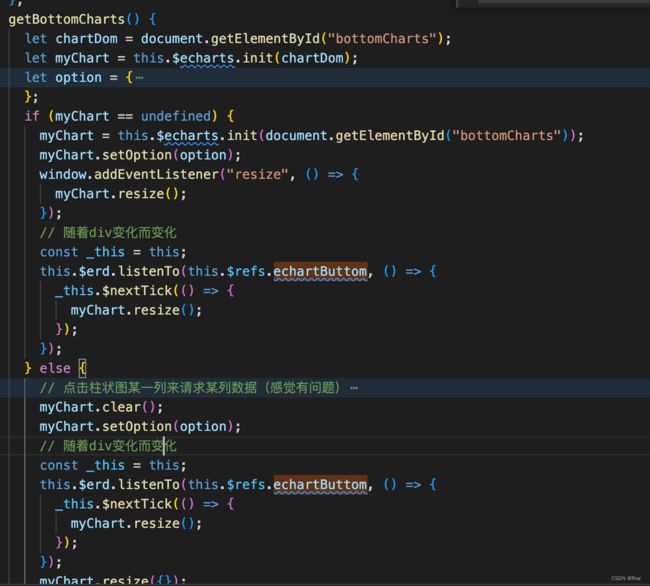
script部分:
问题2:一般都是echart随windows窗口变化而变化,现在需求是外层div能够被拖动,而echart不会随着外层div变化而变化
解决方法:使用element-resize-detector插件监听div
在main.js文件中
// (用来监听div变化)
import ElementResizeDetectorMaker from "element-resize-detector";
Vue.prototype.$erd = ElementResizeDetectorMaker();
在写echart的文件中
在script代码为:
主要代码:
        const _this = this;
        this.$erd.listenTo(this.$refs.echartButtom, () => {
          _this.$nextTick(() => {
            myChart.resize();
          });
        });
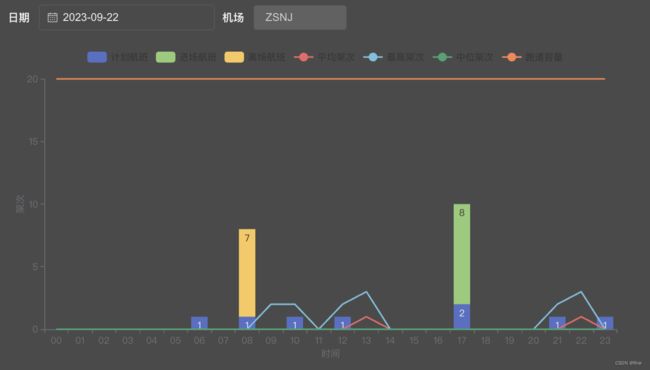
问题3:柱状图叠图
option = {
    tooltip : {
        trigger: 'axis',
        axisPointer : {            // 坐标轴指示器,坐标轴触发有效
            type : 'shadow'        // 默认为直线,可选为:'line' | 'shadow'
        }
    },
    legend: {
        data: ['直接访问', '邮件营销','联盟广告','视频广告','搜索引擎']
    },
     toolbox: {
                show: true,
                feature: {
                    dataZoom: {
                        yAxisIndex: 'none'
                    },
                    dataView: {readOnly: false},
                    magicType: {type: ['line', 'bar']},
                    restore: {},
                    saveAsImage: {}
                }
            },
    grid: {
        left: '3%',
        right: '4%',
        bottom: '3%',
        containLabel: true
    },
    xAxis:  {

        type: 'category',
        data: ['周一','周二','周三','周四','周五','周六','周日']
    },
    yAxis: {
         type: 'value'
    },
    series: [
        {
            name: '直接访问',
            type: 'bar',
            stack: '总量',
            smooth: true,
            label: {
                  normal: {
                      show: true,
                      position: 'insideTop',
                      formatter: function(v) {
                        return v.value || ""
                      }
                  }
              },

            data: [302, 302, 301, 334, 390, 330, 320]
        },
        {
            name: '邮件营销',
            type: 'bar',
            stack: '总量',
              smooth: true,
            label: {
                  normal: {
                      show: true,
                      position: 'insideTop',
                      formatter: function(v) {
                        return v.value || ""
                      }
                  }
              },
            data: [120, 132, 101, 134, 90, 230, 210]
        },
        {
            name: '联盟广告',
            type: 'bar',
            stack: '总量',
              smooth: true,
            label: {
                  normal: {
                      show: true,
                      position: 'insideTop',
                      formatter: function(v) {
                        return v.value || ""
                      }
                  }
              },
            data: [220, 182, 191, 234, 290, 330, 310]
        },
        {
            name: '视频广告',
            type: 'bar',
            stack: '总量',
              smooth: true,
            label: {
                  normal: {
                      show: true,
                      position: 'insideTop',
                      formatter: function(v) {
                        return v.value || ""
                      }
                  }
              },
            data: [150, 212, 201, 154, 190, 330, 410]
        },
        {
            name: '搜索引擎',
            type: 'bar',
            stack: '总量',
              smooth: true,
            label: {
                  normal: {
                      show: true,
                      position: 'insideTop',
                      formatter: function(v) {
                        return v.value || ""
                      }
                  }
              },
            data: [820, 832, 901, 934, 1290, 1330, 1320]
        },
        {
            name: '总计',
            type: 'bar',
            stack: '总计',
            barGap: '-100%',
              smooth: true,
            label: {
                normal: {
                    show: true,
                    position: 'top',
                    textStyle: { color: '#000' },
                    formatter: function(v) {
                        return "总计:" + (v.value)
                    }
                }
            },
            itemStyle: {
                normal: {
                    color: 'rgba(128, 128, 128, 0)',
                    borderWidth: 1,
                    borderColor: '#1FBCD2'
                }
            },
            data: [1600,1600,1600,1600,1600,2600]
        }
    ]
};
问题4:柱状叠图点击不同区域显示不同弹窗内容(主要代码)
     if (myChart == undefined) {
        myChart = this.$echarts.init(document.getElementById("bottomCharts"));
        myChart.setOption(option);
        window.addEventListener("resize", () => {
          myChart.resize();
        });
        // 随着div变化而变化
        const _this = this;
        let form ={};
        this.$erd.listenTo(this.$refs.echartButtom, () => {
          _this.$nextTick(() => {
            myChart.resize();
          });
        });
        myChart.on("click", function (params) {
          if(params.seriesName == '计划航班'){
            form.queryFlag = 'eobt';
          }else if(params.seriesName == '离场航班'){
            form.queryFlag = 'adep';
          }else{
            form.queryFlag = 'ades';
          }
          let index = params.dataIndex;
          form.startTime = timeRangList[index];
          form.endTime = timeRangList[index + 1];
          getPlanListByHour(form).then((res)=>{
            _this.tableData = res.data.data;
          })
          _this.showPlanDetail = true;
        });
      } else {
        myChart.clear();
        myChart.setOption(option);
        myChart.off("click")
        let form ={};
        const _this = this;
        myChart.on("click", function (params) {
          if(params.seriesName == '计划航班'){
            form.queryFlag = 'eobt';
          }else if(params.seriesName == '离场航班'){
            form.queryFlag = 'adep';
          }else{
            form.queryFlag = 'ades';
          }
          let index = params.dataIndex;
          form.startTime = timeRangList[index];
          form.endTime = timeRangList[index + 1];
          getPlanListByHour(form).then((res)=>{
            _this.tableData = res.data.data;
          })
          _this.showPlanDetail = true;
        });
}所有代码:


