合并图形并共享同一个图例的三种方法
简介
小编在科研中,需要将多个图形进行合并,并共享同一个图例。此时应该如何实现?关于图形合并的相关推文写了很多了:R可视乎|合并多幅图形、cowplot包,ggplot2图形排版R包。 但是对于今天这个问题,小编很少注意,在进行查阅资料后,将该技巧进行总结。主要介绍三种方法,参考资料如下:cowplot、ggpubr、patchwork。
绘制示例图形
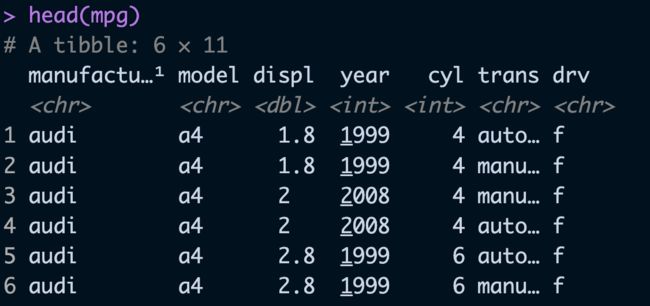
这里以 mpg 数据集为例,前几行数据预览如下:
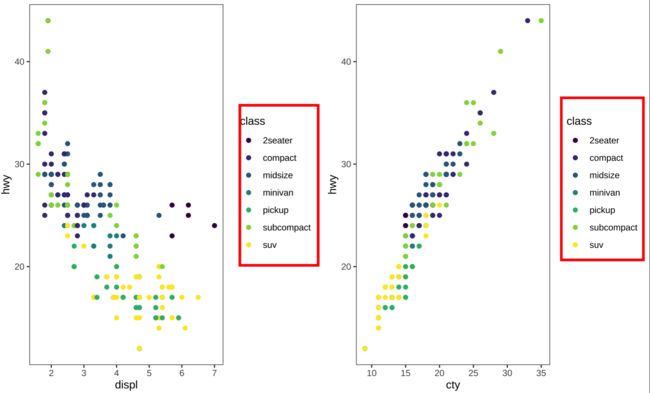
以 displ/cty 为 x 轴, hwy 为 y 轴,颜色用 class 来刻画,绘制散点图。并进行了简单细节调整。
library(ggplot2)
library(viridis)
## 创建图形
plot1 <- ggplot(data = mpg, aes(x = displ, y = hwy, color = class)) +
  geom_point(size=1.7) + scale_color_viridis(discrete = T) +
  theme_bw() + theme(panel.grid = element_blank())

plot2 <- ggplot(data = mpg, aes(x = cty, y = hwy, color = class)) +
  geom_point(size=1.7) + scale_color_viridis(discrete = T) +
  theme_bw() + theme(panel.grid = element_blank())
此时合并后的结果如下:
可以看到,两个图形的图例是相通的,为了图形更佳清晰,美观。我们需要将两个图形的图例进行合并。接下来,小编整理了三种方法供大家参考:
方法一 ggpubr::ggarrange()
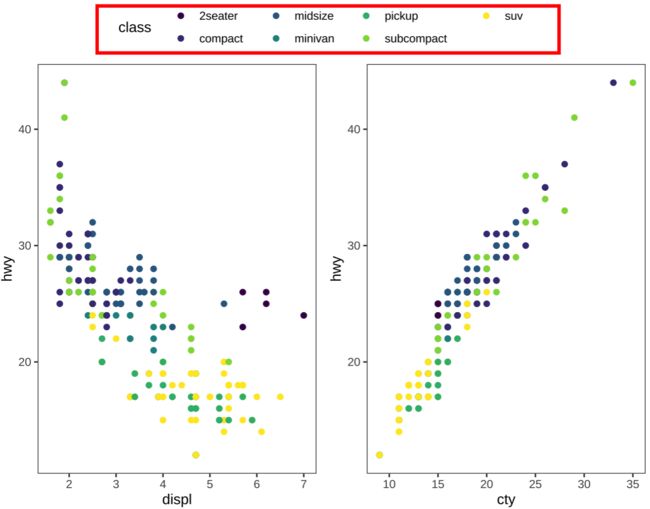
使用 ggarrange() 并配合参数 common.legend = TRUE。此外,调整共享图例位置使用 legend="top"。
library(ggpubr)
ggarrange(plot1, plot2, common.legend = TRUE, legend="top")
方法二 cowplot::plot_grid()
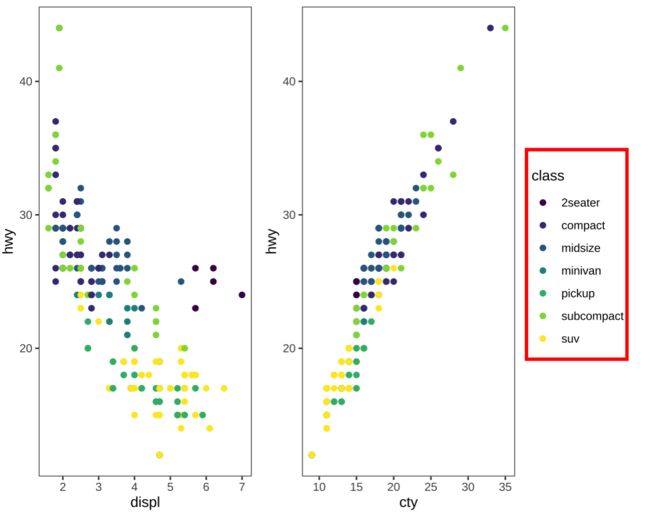
使用 plot_grid() 并配合参数 get_legend()提取某个图形的图例。
library(cowplot)
combined_plot <- plot_grid(plot1 + theme(legend.position = 'none'), plot2 + theme(legend.position = 'none'), ncol = 2)
# 将图例添加到合并后的图形中
plot_grid(combined_plot, get_legend(plot1),rel_widths = c(4, 1))
方法三 patchwork::plot_layout()
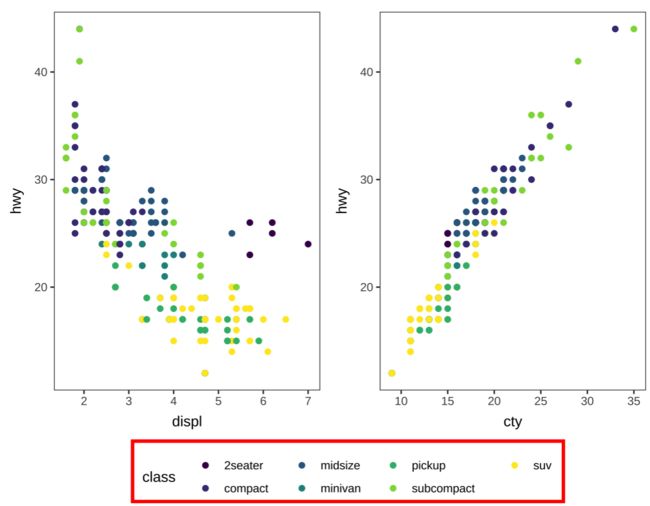
使用 plot_layout() 并配合参数 guides = "collect"。此外,调整共享图例位置使用 & theme(legend.position='bottom')。
library(patchwork)
plot1 + plot2 + plot_layout(guides = "collect") &
  theme(legend.position='bottom')
