springboot 集成prometheus监控平台详解
今天我们开始分享springboot 集成prometheus监控平台,从这个纬度纵深分析监控平台的使用及原理,持续有十多篇文章依次分析。先使用再原理、先客户端再服务端、先web接口监控再软硬件服务监控。下面我们开始springboot集成prometheus.
1、springboot 引入 prometheus相关jar包
            org.springframework.boot
            spring-boot-starter-actuator


            io.micrometer
            micrometer-registry-prometheus
            1.1.4
特别注意,boot 版本 2.1.6.RELEASE,对应的prometheus 版本!否则会有问题。
2、.yml 配置文件配置:
server:
  port: 8081
  servlet:
    context-path: /nandao-pc-api


#prometheus监控平台配置
management:
  endpoints:
    web:
      exposure:
        include: "*"
        exclude: configprops
  endpoint:
    health:
      show-details: ALWAYS
  metrics:
    tags:
      application: ${server.servlet.context-path}

spring:
  servlet:
    multipart:
      max-file-size: 100MB
      max-request-size: 300MB
3、业务代码里监控某个接口:
/**
 * @author wanghuainan
 * @date 2020/9/8
 */
@RestController
@RequestMapping("/promethues/")
@Slf4j
public class PrometheusController {

    @Autowired
    MeterRegistry registry;

    /**
     * 指标类型设置
     */
    private Counter counter_core;
    private Counter counter_index;
    private AtomicInteger app_online_count;

    /**
     * 服务启动时创建自定义指标
     */
    @PostConstruct
    private void init(){
        counter_core = registry.counter("app_requests_method_count", "method", "PrometheusController.core");
        counter_index = registry.counter("app_requests_method_count", "method", "PrometheusController.index");
        app_online_count = registry.gauge("app_online_count", new AtomicInteger(0));
    }


    /**
     * 监控平台是否可用,没调用一次就记录一次,每次调用就加一
     * @return
     */
    @GetMapping("testIsUsable")
    public R testIsUsable() {
        counter_index.increment();
        return R.ok(counter_index.count() + " index of springboot-prometheus.");
    }
    /**
     * 监控平台核心接口请求次数
     * @return
     */
    @GetMapping("testIsCore")
    public R testIsCore() {
        counter_core.increment();
        return R.ok(counter_core.count() + " index of springboot-prometheus.");
    }

    /**
     * 测试实时在线人数,动态数据,每次请求数据可能都不一样
     * @return
     */
    @RequestMapping(value = "/online")
    public Object online(){
        int people = 0;
        try {
            people = new Random().nextInt(2000);
            app_online_count.set(people);
        } catch (Exception e){
            return e;
        }
        //return R.error(HuobiResultCode.PARAM_ERROR);
        return "current online people: " + people;
    }

}
4、启动boot服务后,访问监控的数据,接口是:
http://127.0.0.1:8081/nandao-pc-api/actuator/prometheus

或者浏览器访问:
 这些访问访问到的数据都是监控平台默认的指标数据,后期我们会详细分析。
5、访问一个监控的业务接口后,再次访问监控的数据:
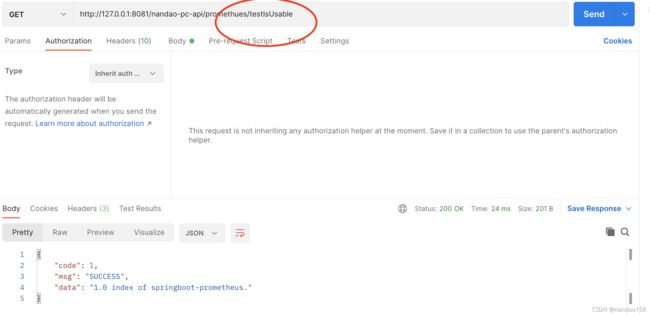
再次访问:http://127.0.0.1:8081/nandao-pc-api/actuator/prometheus
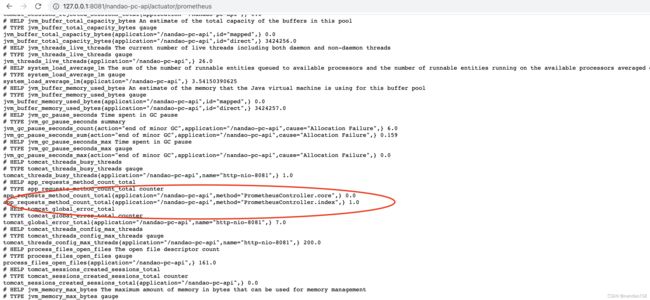
以上可知监控到了自定义指标的数据,下篇我们分享,通过切面监控某个服务所有接口的请求次数、时间、异常次数等,敬请期待!