MATLAB | R2023b更新了哪些好玩的东西?
R2023b来啦!!废话不多说看看新版本有啥有趣的玩意和好玩的特性叭!!依旧把绘图放最前面叭,有图的内容看的人多。。
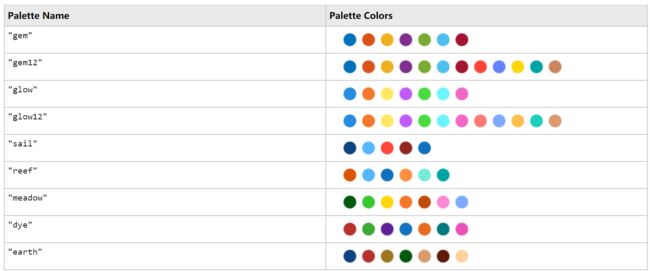
1 调色板
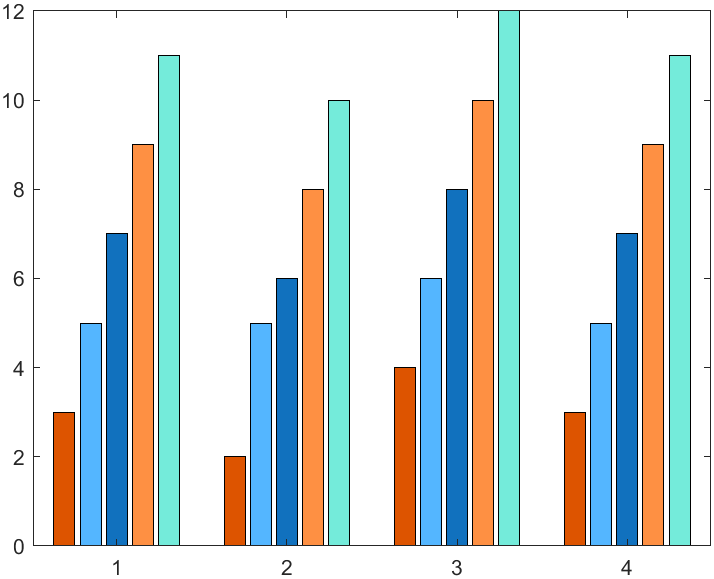
MATLAB终于不只有一套配色了,诸君且看:
y = [3 5 7 9 11;
     2 5 6 8 10;
     4 6 8 10 12;
     3 5 7 9 11];

bar(y)

C = orderedcolors("reef");
colororder(C)
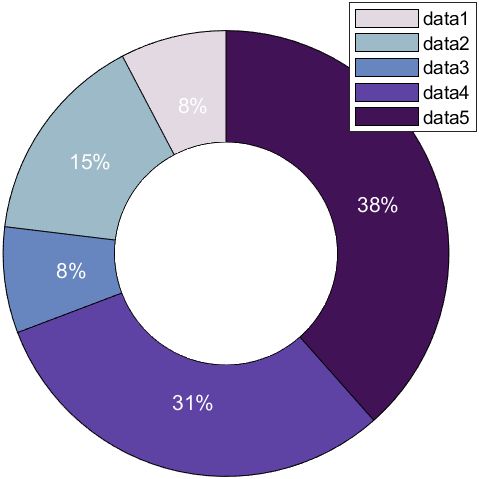
2 环形饼状图(甜甜圈图)
我在今年一月的时候写过一小段代码来专门实现这个功能,大概是这样:
% circularPieDemo
X=[1,2,1,4,5];
pieHdl=pie(X);
hold on
% 颜色列表,修改颜色和标签位置
colorList=[0.8858    0.8500    0.8880
    0.6173    0.7311    0.7864
    0.4041    0.5218    0.7440
    0.3668    0.2640    0.6465
    0.2589    0.0720    0.3397];
for i=2:2:length(pieHdl)
    pieHdl(i).Position=pieHdl(i).Position.*.57;
    pieHdl(i).Color=[1,1,1];
    pieHdl(i-1).FaceColor=colorList(i/2,:);
end
legend('AutoUpdate','off')
% 画个圆
t=linspace(0,2*pi,200);
fill(cos(t).*.5,sin(t).*.5,'w')
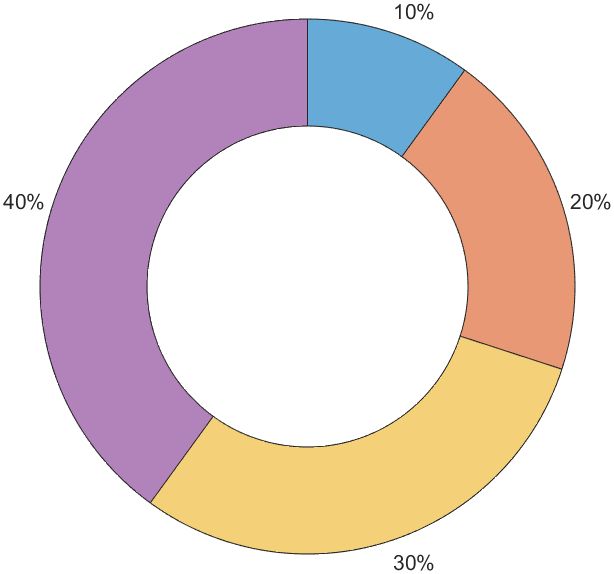
而现在这个功能官方已经有donutchart函数可以直接实现啦~
data = [1 2 3 4];
donutchart(data)
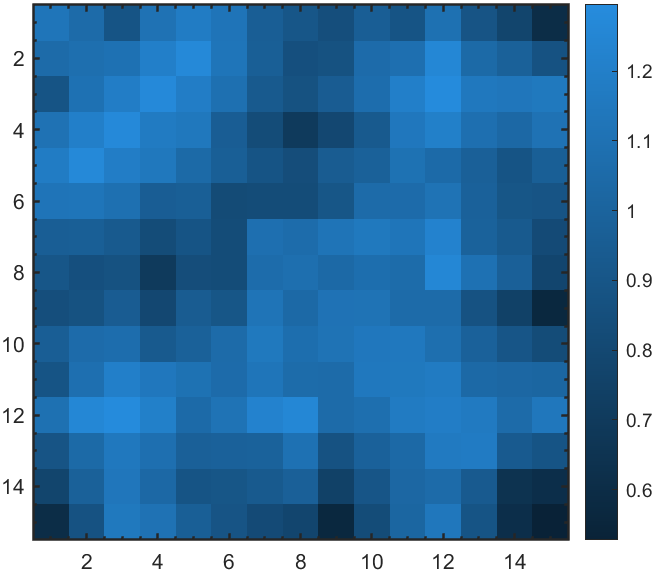
3 新配色(abyss)
一个名为abyss的蓝黑配色。
XData=rand(15,15);
XData=XData+XData.';
H=fspecial('average',3);
XData=imfilter(XData,H,'replicate');

imagesc(XData)
colormap('abyss')
colorbar
hold on

ax=gca;
ax.DataAspectRatio=[1,1,1];
ax.LineWidth=1.2;
ax.XMinorTick='on';
ax.YMinorTick='on';
ax.ZMinorTick='on';
ax.GridLineStyle=':';
4 逆序图例
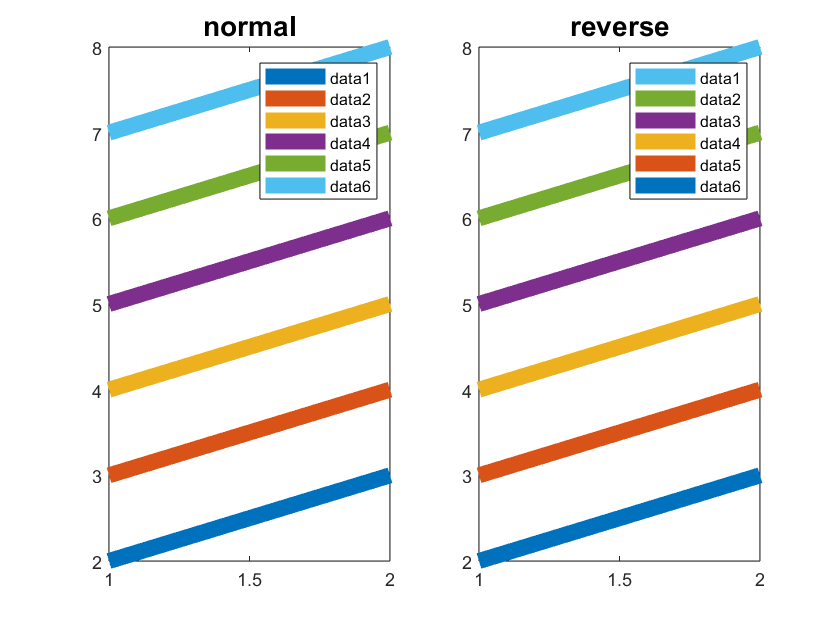
通过设置Direction属性改变图例方向:
X=1:2;
Y=(1:2)+(1:6)';

subplot(1,2,1)
plot(X,Y,'LineWidth',8);
legend
title('normal','FontSize',14,'FontWeight','bold')

subplot(1,2,2)
plot(X,Y,'LineWidth',8);
legend('Direction','reverse')
title('reverse','FontSize',14,'FontWeight','bold')
5 轴副标签
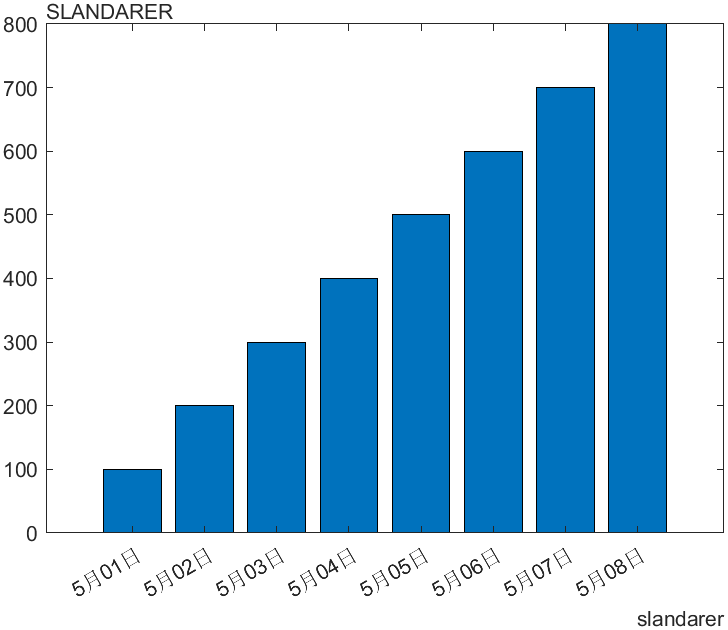
通过
- xsecondarylabel
- ysecondarylabel
这俩玩意设置
x = datetime(2020,5,1:8);
y = 100:100:800;
bar(x,y)
xsecondarylabel("slandarer");
ysecondarylabel("SLANDARER")
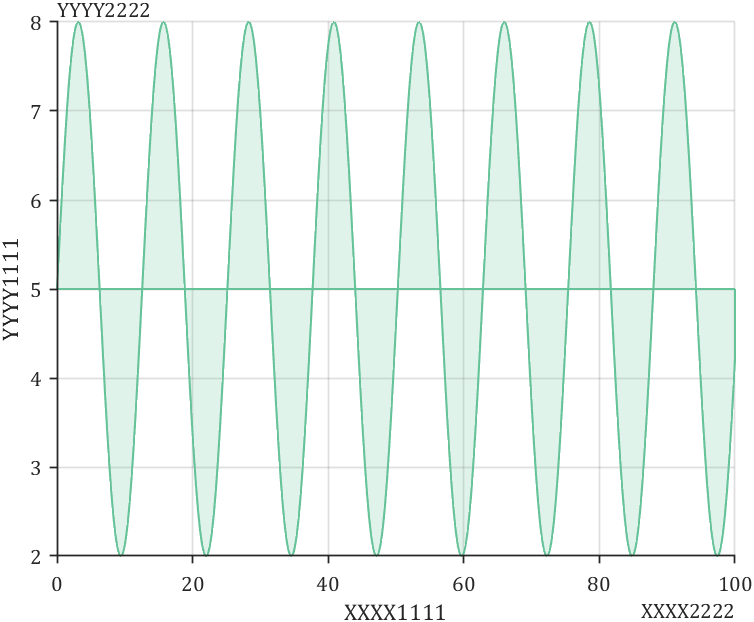
老版本我也讲过有设置办法:
x = linspace(0,100,1000);
y = 5 + 3*sin(x./2);
fill([x x(end)],[y y(1)],[0.40 0.76 0.60],'FaceAlpha',.2,...
    'LineWidth',1,'EdgeColor',[0.40 0.76 0.60])
% 坐标区域基础修饰
ax=gca; grid on;
ax.FontName  = 'Cambria';
ax.TickDir   = 'out';
ax.LineWidth = .8;
ax.Box       = 'off';

% 显示次标签
ax=gca;
% X轴主次标签
xlabel('XXXX1111')
ax.XRuler.SecondaryLabel.String='XXXX2222';
ax.XRuler.SecondaryLabel.Visible='on';
% Y轴主次标签
ylabel('YYYY1111')
ax.YRuler.SecondaryLabel.String='YYYY2222';
ax.YRuler.SecondaryLabel.Visible='on';
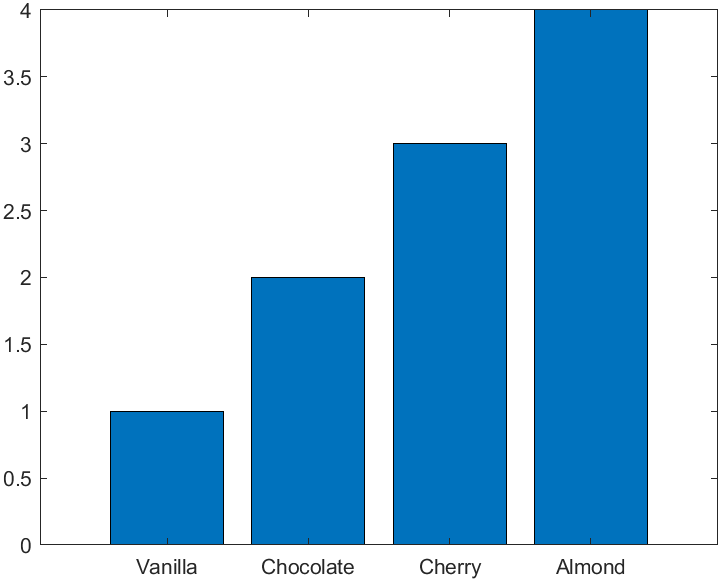
6 柱状图更容易创建
创建的时候可以直接用字符串数组来作为X坐标:
bar(["Vanilla","Chocolate","Cherry","Almond"],[1 2 3 4])
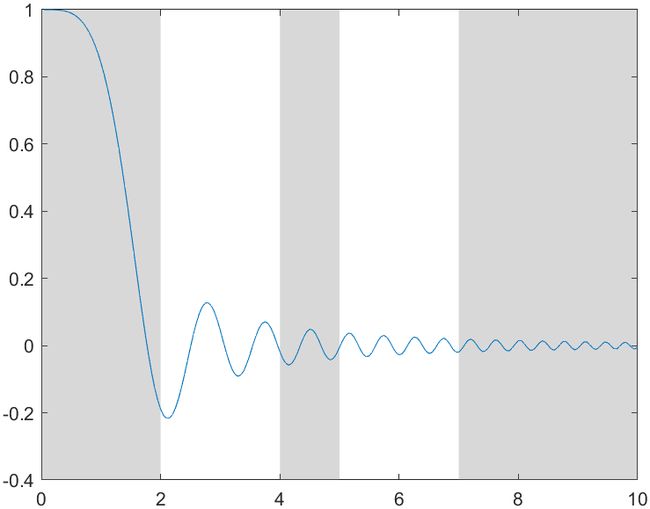
7 阴影区域函数优化
可以通过输入矩阵更方便创建多个阴影区域:
x = 0:0.05:10;
y = sin(x.^2)./(x.^2);
plot(x,y)
X = [-Inf 4 7; 2 5 Inf];
xregion(X)
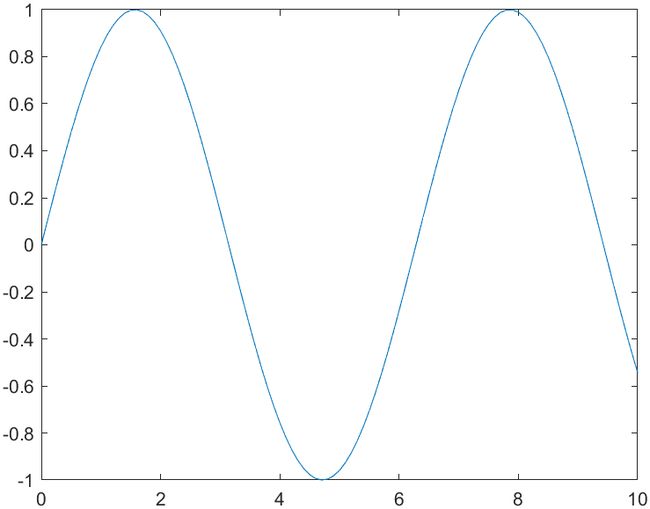
8 根据文本调整轴范围
随便画个图:
x = 0:0.1:10;
y = sin(x);
plot(x,y)
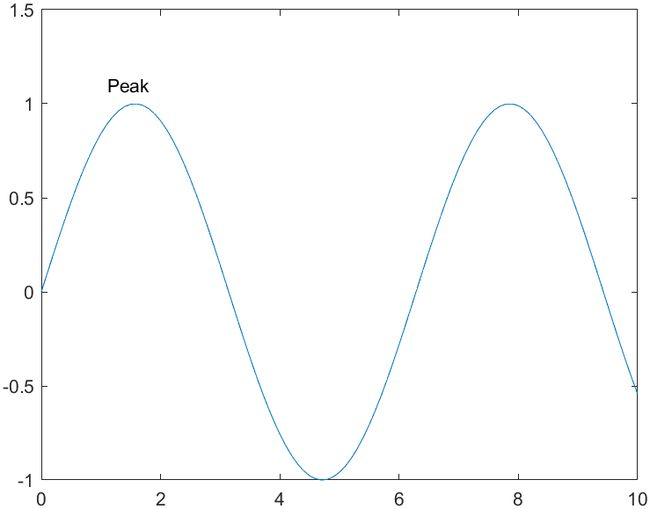
创建文本标签的时候设置AffectAutoLimits属性开启,如果文字被放在画布外面,就能自带调整画布范围来适应文字:
text(1.1,1.1,"Peak",AffectAutoLimits="on")
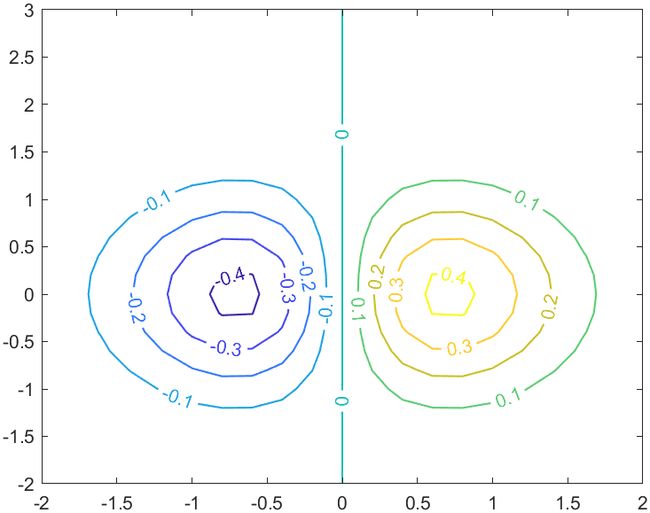
9 等高线图文本颜色
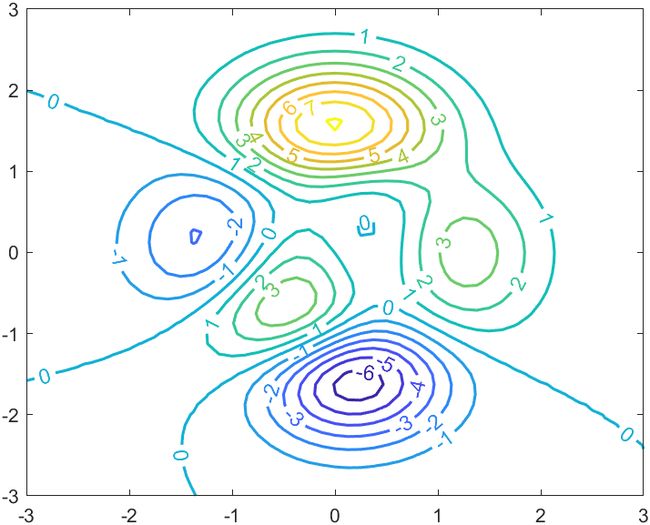
等高线图的文本颜色可以跟随等高线颜色变化啦:可以通过设置LabelColor属性来实现:
x = -2:0.2:2;
y = -2:0.2:3;
[X,Y] = meshgrid(x,y);
Z = X.*exp(-X.^2-Y.^2);
contour(X,Y,Z,'ShowText','on','LineWidth',1,'LabelColor','flat')
对于老版本我以前也给过一个改颜色的方法:
[X,Y,Z] = peaks;
[C,hContour] = contour(X,Y,Z, 'ShowText','on', 'LevelStep',1, 'LineWidth',1.5);


updateContours(hContour);
% 因为标签位置是自动更新的属性,会刷新掉颜色,因此添加listener检测
addlistener(hContour, 'MarkedClean', @(h,e)updateContours(hContour));
function updateContours(hContour)
    drawnow
    levels = hContour.LevelList;
    labels = hContour.TextPrims; % 获取标签基础对象
    lines  = hContour.EdgePrims; % 获取边缘基础对象
    for idx = 1 : numel(labels)
        labelValue = str2double(labels(idx).String);
        lineIdx = find(abs(levels-labelValue)<10*eps, 1);  % 找到对应层级
        labels(idx).ColorData = lines(lineIdx).ColorData;  % 修改标签颜色
        labels(idx).Font.Size = 11;
    end
    drawnow
end
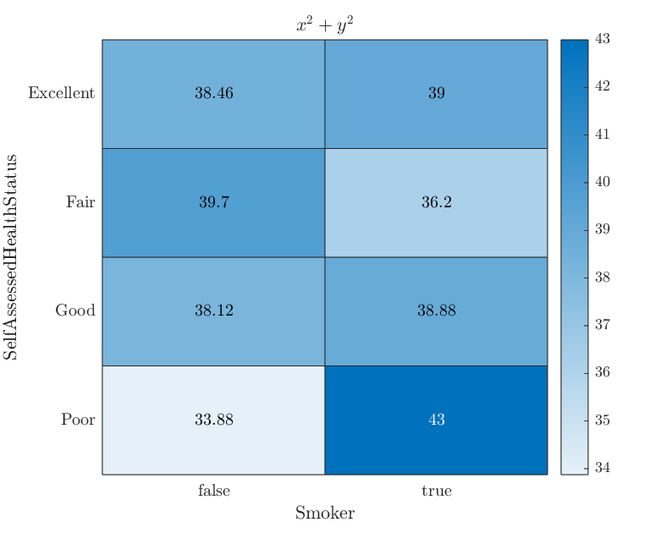
10 热图文本的latex支持
load patients
tbl = table(LastName,Age,Gender,SelfAssessedHealthStatus,...
    Smoker,Weight,Location);

h = heatmap(tbl,'Smoker','SelfAssessedHealthStatus',...
    'ColorVariable','Age','Interpreter','latex');
title('$x^2+y^2$')
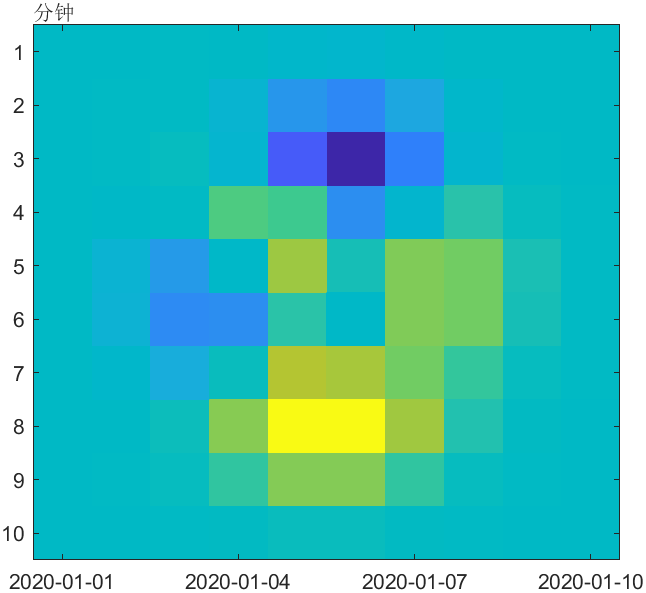
11 image函数以时间为横坐标
image函数可以以时间为横坐标了,感觉可以用来制作那种github同款日历热力图:
x = datetime(2020,1,[1 10]);
y = minutes([1 10]);
C = peaks(10);
imagesc(x,y,C)
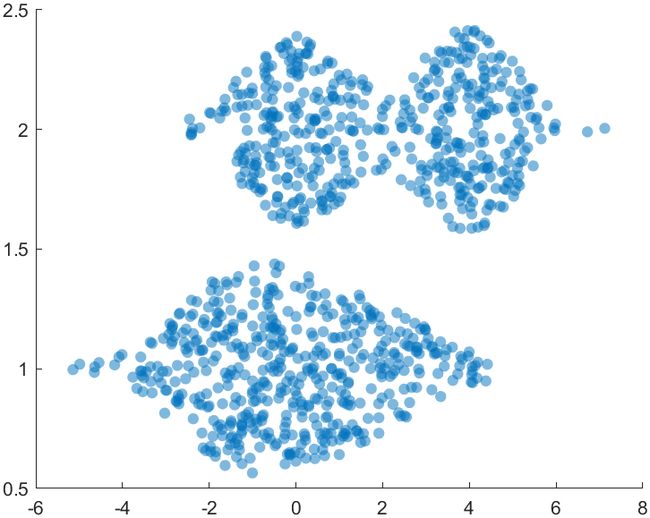
12 横向集群图
只需要设置YJitter并交换x,y数据:
x1 = ones(1,500);
x2 = 2 * ones(1,500);
x = [x1 x2];
y1 = 2 * randn(1,500);
y2 = [randn(1,250) randn(1,250) + 4];
y = [y1 y2];
swarmchart(y,x,'filled','MarkerFaceAlpha',0.5,'MarkerEdgeAlpha',0.5,'YJitter','density')
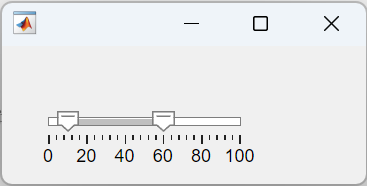
13 APP 滑动条允许多个滑块
fig = uifigure;
sld = uislider(fig,"range",Value=[10 60]);
14 App框选控件被选中时返回值
其实App designer也更了挺多的,这里不详细展开,其中还有个比较有意思的就是这条,当下拉列表和框选列表某一项被选中时候,一般会返回被选中的玩意的字符串,比如返回个apple啥的不利于后期处理,而可使用ItemsData将每个选项对应到一个数值,就比较方便处理和识别:
fig = uifigure;
dd = uidropdown(fig, ...
    Items=["Apple","Banana","Cherry"], ...
    ItemsData=[0.5 0.2 1.3]);
idx = dd.ValueIndex;

disp(dd.Items(idx) + ": " + dd.Value)
% Apple: 0.5
15 json数据读取
终于可以读取json数据啦,大概是这么读的:
S = readstruct("myFile.json")
16 三个增添删减元素的函数
- resize 根据输入数据的长度是否小于或大于目标长度来添加或删除元素。调整大小的数据与目标长度匹配。
- paddata 只添加元素。如果输入数据的长度大于或等于目标长度,则输出数据与输入数据相同。
- trimdata 只删除元素。如果输入数据的长度小于或等于目标长度,则输出数据与输入数据相同。
resize
- https://ww2.mathworks.cn/help/matlab/ref/resize.html
A = [1,2,3];
B1 = resize(A,6)
B2 = resize(A,2)

% B1 =
%      1     2     3     0     0     0
% B2 =
%      1     2
paddata
- https://ww2.mathworks.cn/help/matlab/ref/paddata.html
A = [1,2,3];
B1 = paddata(A,6)
B2 = paddata(A,2)

% B1 =
%      1     2     3     0     0     0
% B2 =
%      1     2     3
trimdata
- https://ww2.mathworks.cn/help/matlab/ref/trimdata.html
A = [1,2,3];
B1 = trimdata(A,6)
B2 = trimdata(A,2)

% B1 =
%      1     2     3
% B2 =
%      1     2
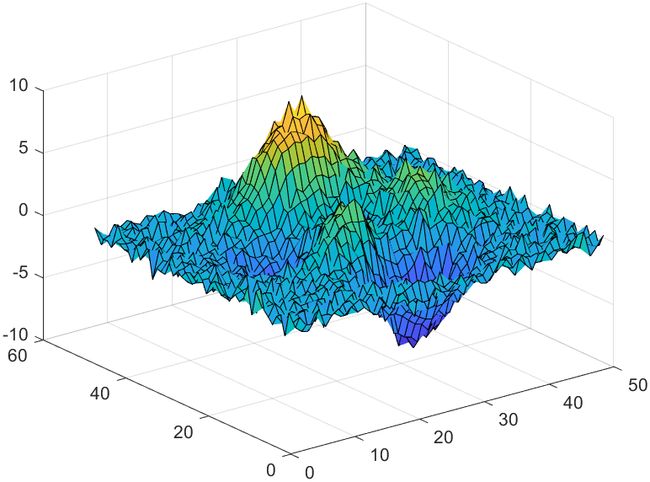
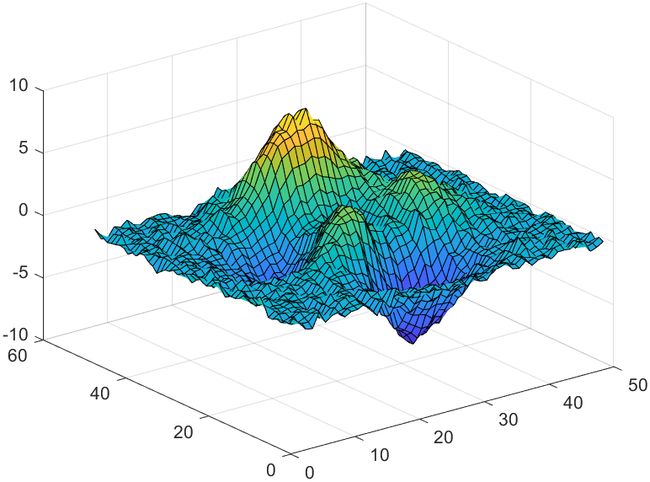
17 2维数据平滑
A = peaks;
rng(0,"twister")
A = A + 0.5*randn(size(A));
surf(A)


B = smoothdata(A);
surf(B)
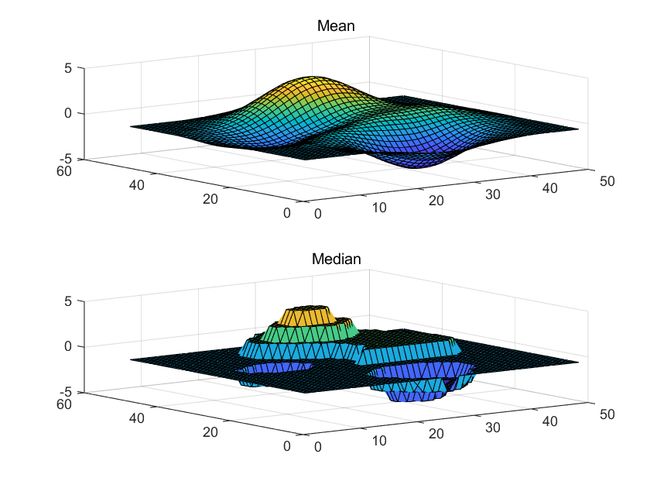
可选平滑方法:
[bins,edges] = discretize(peaks,10);
A = edges(bins);
B1 = smoothdata2(A);
B2 = smoothdata2(A,"movmedian");

tiledlayout(2,1)

nexttile
surf(B1)
title("Mean")

nexttile
surf(B2)
title("Median")
平滑方法有很多(“movmean” (default) | “movmedian” | “gaussian” | “lowess” | “loess” | “sgolay”),可自行前往查看:
- https://ww2.mathworks.cn/help/matlab/ref/smoothdata2.html
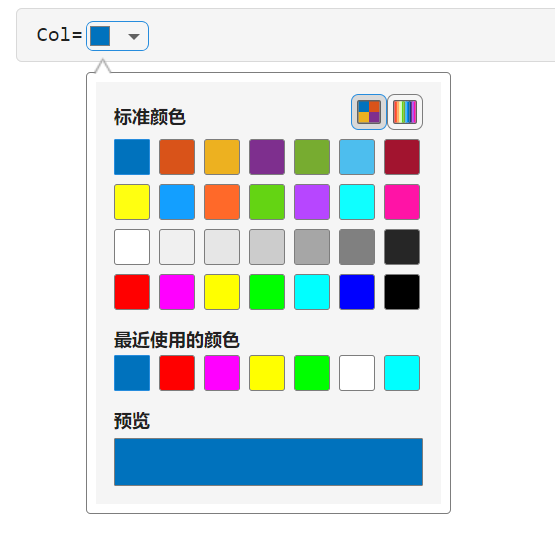
18 实时脚本新增颜色选择器
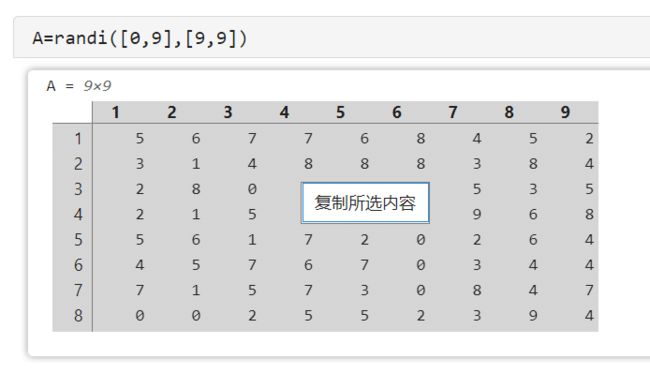
19 实时脚本带格式复制数据
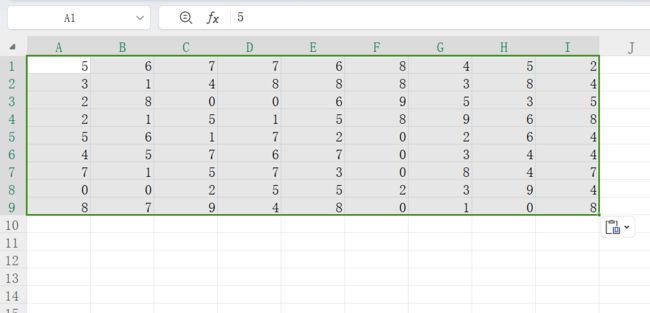
实时脚本输出的矩阵或者表格可以直接复制到excel啦:
右键复制所选内容:
直接复制到excel:
完
当然以上只是我觉得更新的比较有意思的东西,其他还有很多硬件更新,运行速度加速等一系列更新,可自行前往release note进行查看,这里不一一赘述啦~
