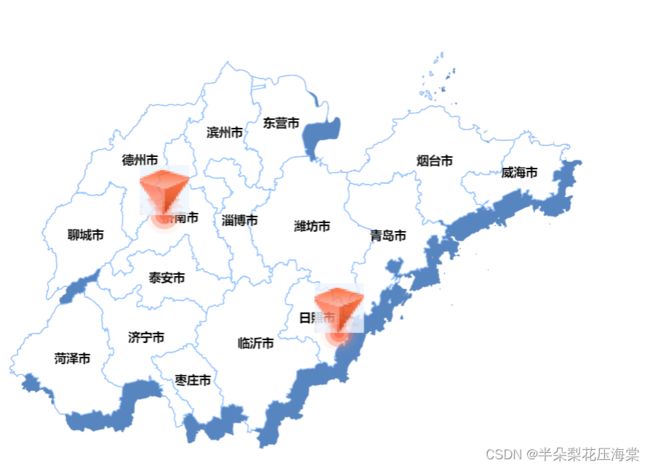
ECharts 地图中来实现自定义图标效果
相关的图片和数据,也可以自己从网上找:
https://download.csdn.net/download/weixin_51958206/87778012
<template>
  <div>
    <div ref="charts" style="width: 700px; height: 600px"></div>
  </div>
</template>
<script>
import shanDong from './shandong'
export default {
  props: {},
  components: {},
  data() {
    return {};
  },
  created() {
    this.$nextTick(() => {
      this.initCharts();
    });
  },
  mounted() {
    this.initCharts();
  },
  methods: {
    initCharts() {
      const charts = this.$echarts.init(this.$refs["charts"]);
      let data = [
        {
          name: "济南",
          value: [117.000923,
            36.675807],
        },
        {
          name: "日照",
          value: [119.461208,
            35.428588],
        },
      ];
      let LableData = [
        {
          name: "济南",
          value: [117.000923,
            36.675807],
        },
        {
          name: "日照",
          value: [119.461208,
            35.428588],
        },

      ];
      var option = {
        backgroundColor: "#fff",
        //地下的那块
        geo: {
          map: '山东',
          aspectScale: 0.75, //长宽比
          zoom: 1,
          top: 90,
          roam: false,
          itemStyle: {
            normal: {
              areaColor: "#e74c3c",
              shadowColor: '#5785C0', //阴影
              shadowOffsetX: 12,
              shadowOffsetY: 16,
              // borderWidth:2,
              borderColor: "#e74c3c"
            },
            emphasis: {
              areaColor: '#e74c3c',
              borderWidth: 0,
              color: 'green',
              label: {
                show: true
              }
            }
          },
          regions: [],
        },
        visualMap: {
          //图例值控制
          min: 0,
          max: 10000,
          calculable: false,
          show: false,
          right: 50,
          // seriesIndex: 1,
          bottom: 50,
          color: ["#FD7152"],
          // inRange:{
          //   symbolSize: [10, 20]},
          textStyle: {
            color: "#fff",
          },
        },
        series: [
          // 常规地图
          {
            type: 'map',
            roam: false,
            layoutSize: "90%",
            aspectScale: 0.75,
            selectedMode: false,
            zoom: 1,
            roam: false,
            map: '山东', //使用
            top: 90,
            label: {
              normal: {
                show: true,
                textStyle: {
                  color: '#000000',
                  fontSize: 12,
                  fontWeight: 600
                }
              },
            },
            itemStyle: {
              normal: {
                areaColor: '#ffffff',  //区域颜色
                borderColor: '#91C2FF',  //边框颜色
                borderWidth: 1
              },
            },
            emphasis: {
              itemStyle: {
                areaColor: '#B6D7FF',
                borderColor: '#91C2FF',
                borderWidth: 1
              },
              label: { // 文字
                show: true,
                color: '#0062CB',
                fontSize: 12,
                fontWeight: 600
              },

            }
          },
          // 区域散点图
          {
            type: "effectScatter",
            coordinateSystem: "geo",
            zlevel: 2,
            symbolSize: 10,
            rippleEffect: {
              //坐标点动画
              period: 2,
              scale: 4,
              brushType: "fill",
            },
            label: {
              normal: {
                show: false,
                position: "right",
                formatter: "{b}",
                color: "#b3e2f2",
                fontWeight: "400",
                fontSize: 12,
              },
            },

            data: data,
            itemStyle: {
              //坐标点颜色
              normal: {
                show: false,
                color: "#ff3f3a",
                shadowBlur: 20,
                shadowColor: "#fff",
              },
              emphasis: {
                areaColor: "#f00",
              },
            },
          },
          //图标
          {
            name: "lable",
            type: "scatter",
            coordinateSystem: "geo",
            symbol: 'image://' + require("./003.png"),
            symbolSize: [50, 50],
            symbolOffset: [0, "-50%"],
            hoverAnimation: true,
            zlevel: 2,
            label: {
              normal: {
                show: false,
                textStyle: {
                  color: "#fff",
                  lineHeight: 15,
                },
                formatter(params) {
                  return params.data.value[2];
                },
              },
            },

            itemStyle: {
              normal: {
                color: "#6495ED", //标志颜色
                opacity: 0.8,
                borderColor: "#aee9fb",
                borderWidth: 0.6,
              },
            },
            showEffectOn: "render",
            rippleEffect: {
              brushType: "stroke",
            },
            data: LableData,
          },
        ],
      };
      this.$echarts.registerMap("山东", shanDong);
      charts.setOption(option);
    },
  },
};
</script>
<style  scoped>
</style>
