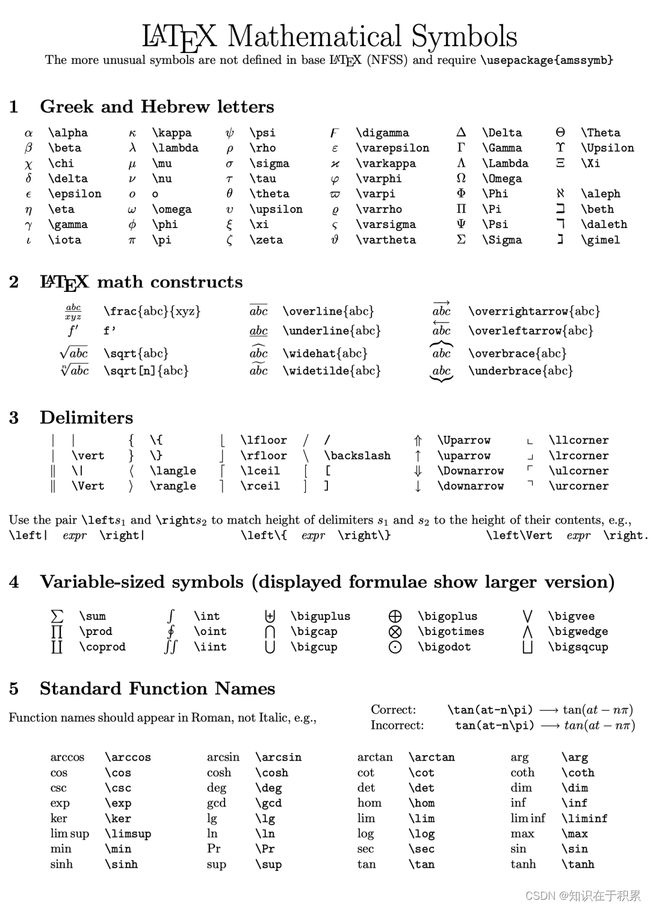
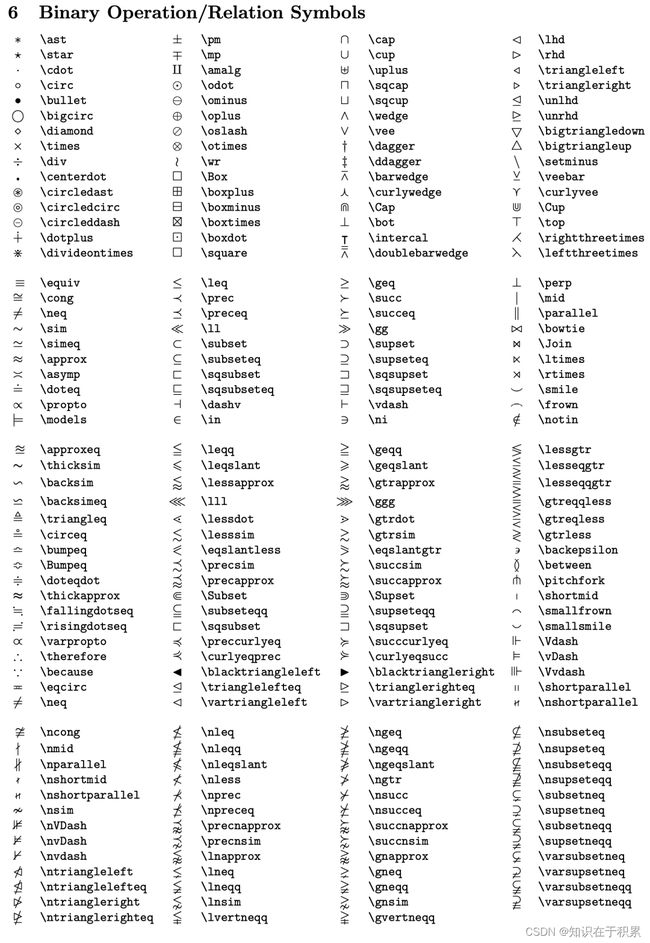
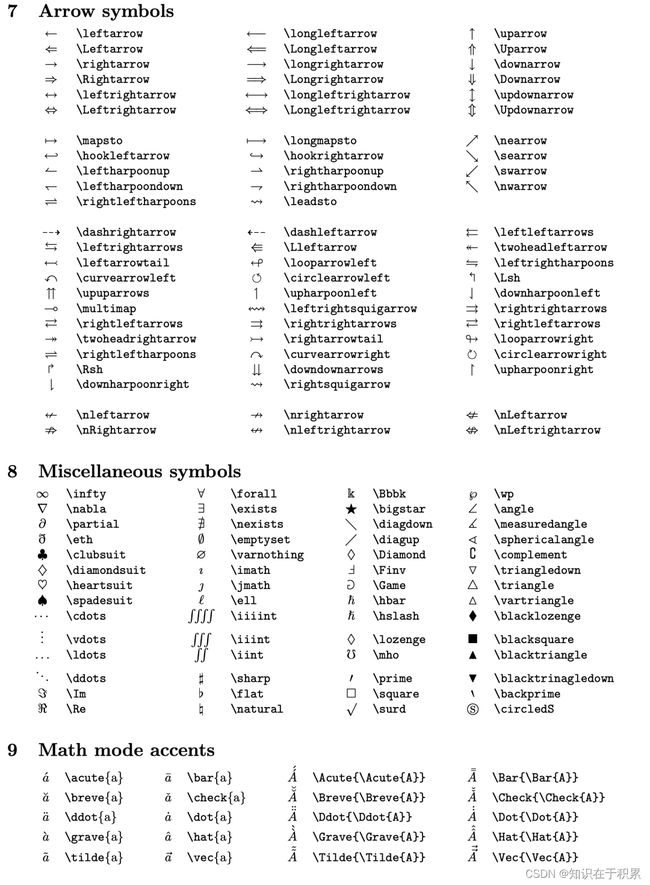
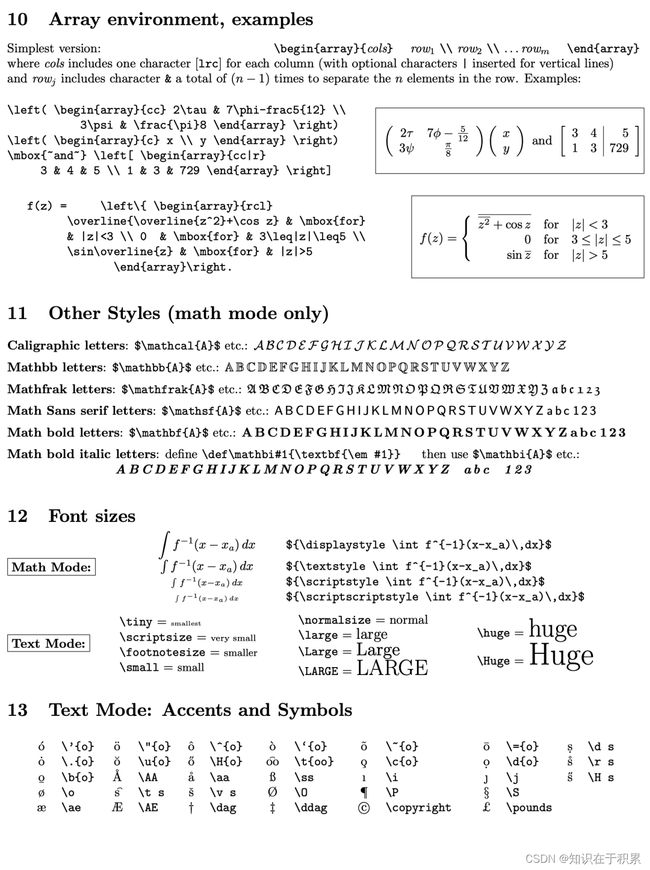
LaTeX中常用符号及其模板
以下内容来源于微信公众号: 文/零星 拾梦的星星
这里主要是收藏便于学习
See https://mp.weixin.qq.com/s/YYMP_OUpXG61c5jgIRGyQw
LaTeX中的数学符号
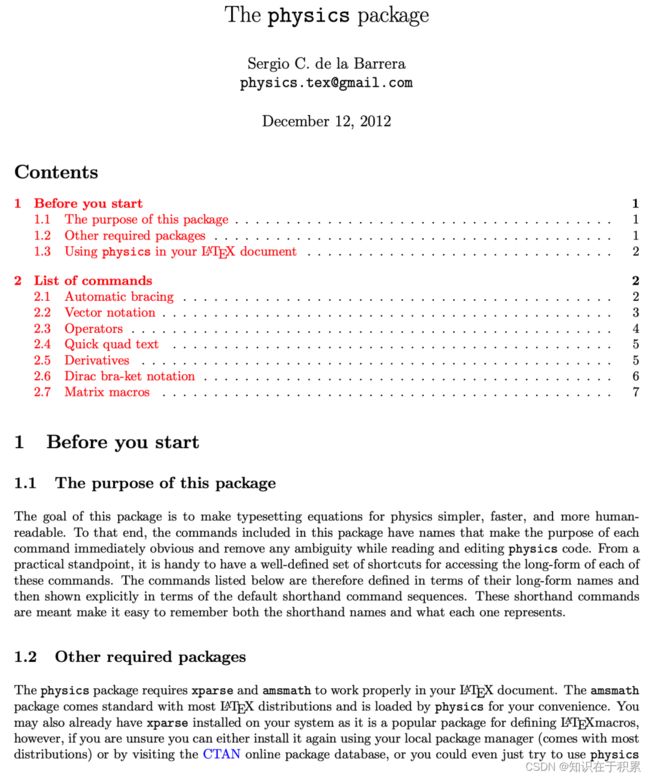
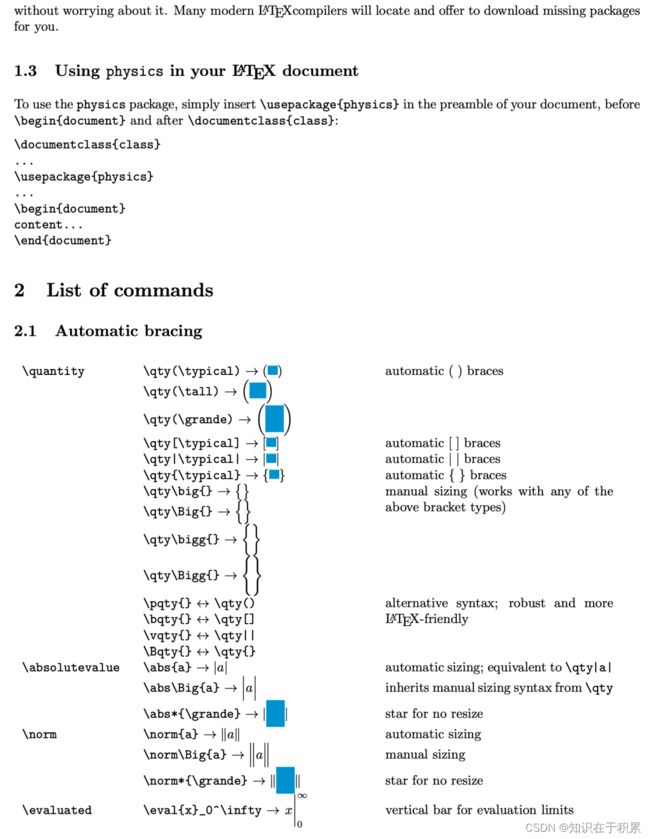
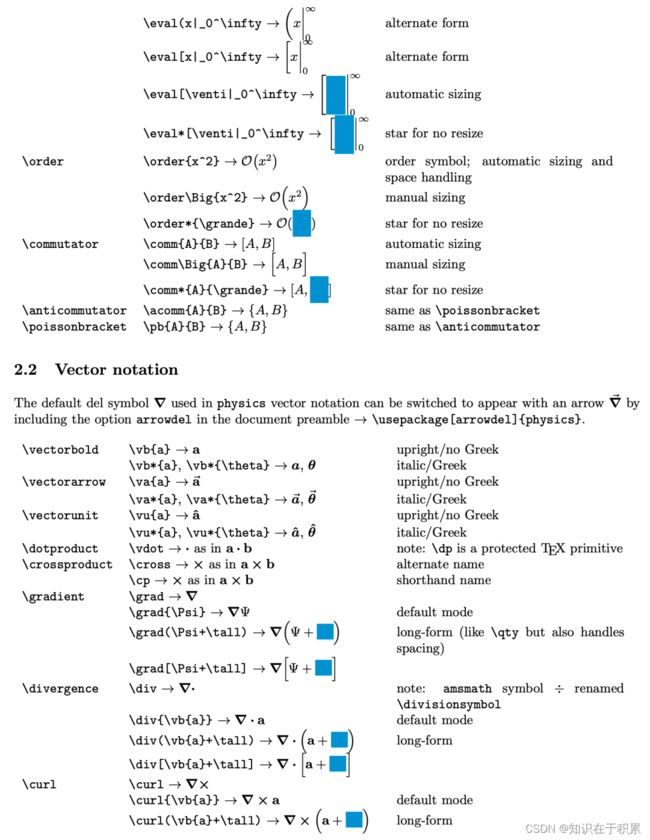
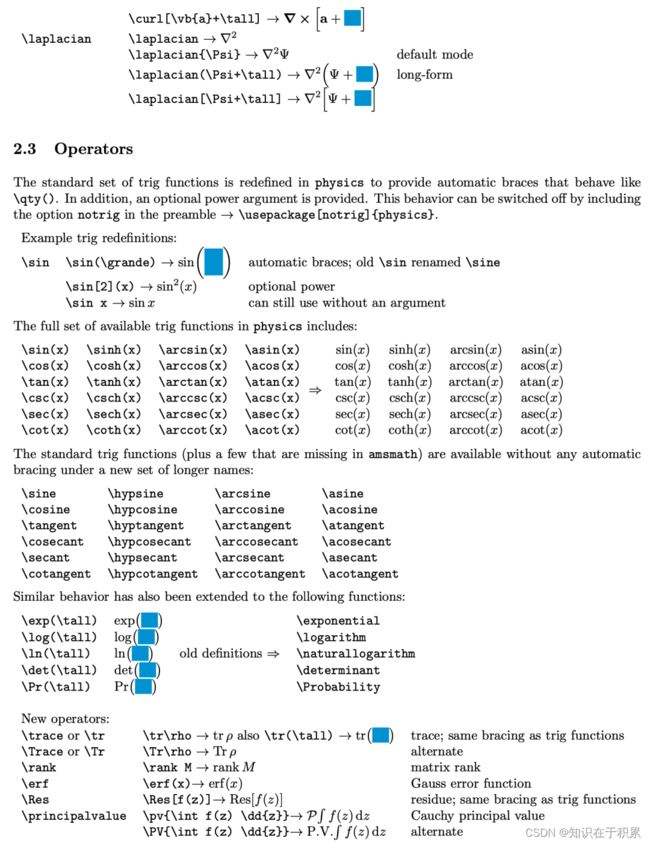
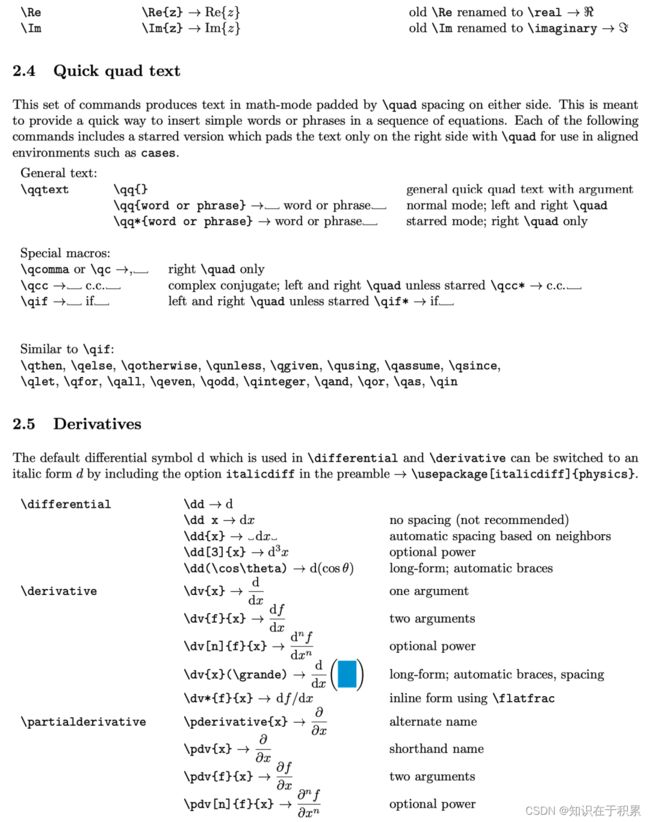
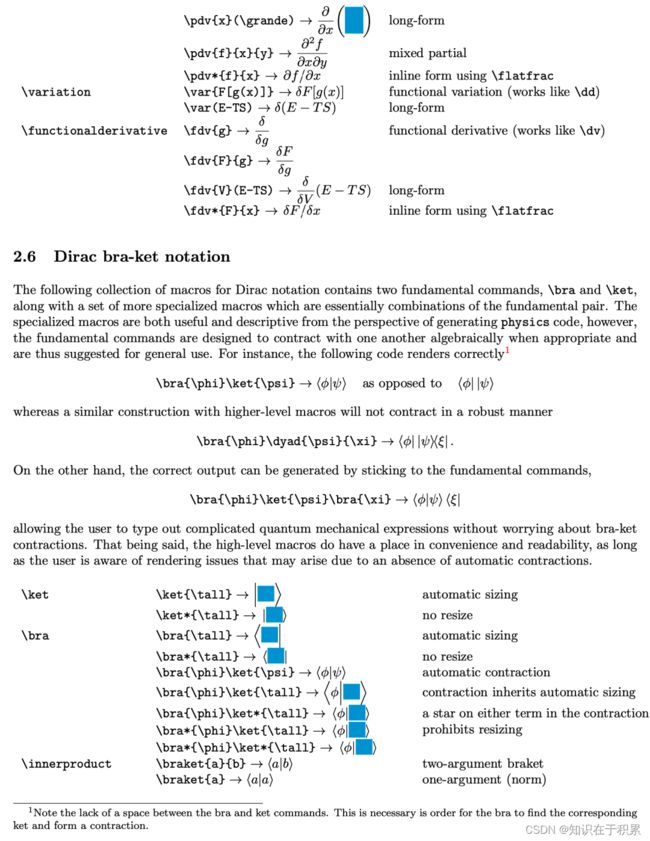
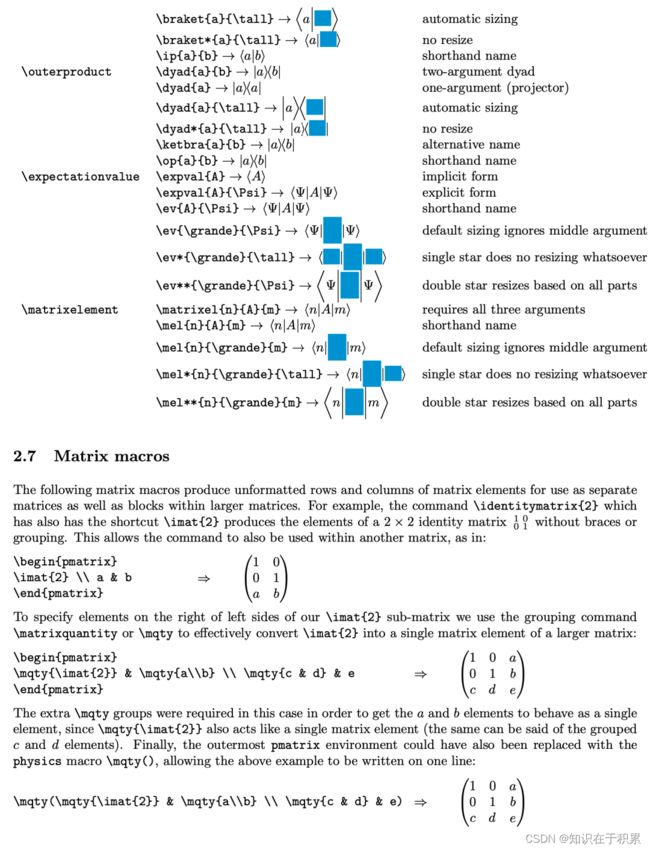
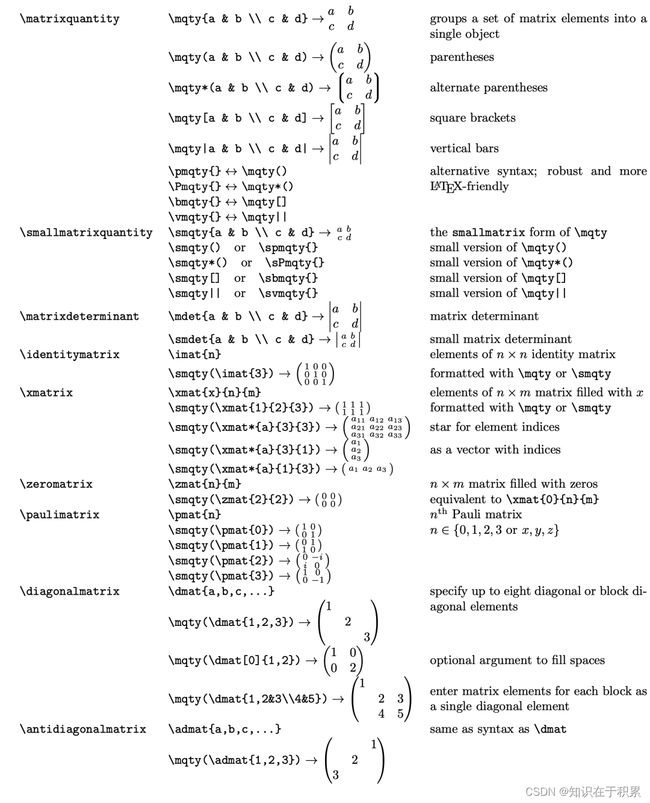
LaTeX中的物理宏包
模板
%导言区
\documentclass{article}   %article, book, report, letter

\usepackage{amsmath}
\usepackage[fontset=mac]{ctex}
\usepackage[hidelinks,colorlinks,linkcolor=blue]{hyperref}%插入目录并加上超链接
\usepackage{color}
\usepackage{minted}
\usepackage{graphicx}
\graphicspath{{figures/}}
\usepackage{amssymb}
%\usepackage{latexalpha2}%在LaTeX中用Mathematica计算
\usepackage{indentfirst}%首行缩进
\setlength{\parindent}{1em}
%\usepackage{times}%使得英文默认字体都是Times New Roman
%\usepackage[justification=centering]{caption}%全局图片标题居中
\usepackage{float}
\usepackage{tcolorbox}%加边框
\usepackage{physics}

\usepackage{caption}
\usepackage{subfigure}
\usepackage{multirow}

%参考文献
\usepackage[style=numeric,backend=biber]{biblatex}
\addbibresource{test.bib}

% 页面设置
\usepackage{geometry}
\geometry{a4paper,scale=0.8}
%\usepackage{fontspec}
%\setmonofont{Consolas}
%\usepackage{chngpage}

\definecolor{shadecolor}{rgb}{0.92,0.92,0.92}%文字背景色

\newcommand{\huanhang}[2]{\begin{tabular}{@{ }#1@{ }}#2\end{tabular}}%定义表格内换行的命令

%\usepackage[ddmmyyyy]{datetime}%显示英文日期
%\renewcommand{\dateseparator}{.}

%\renewcommand{\today}{\ifnum\number\day<10 0\fi \number\day \space
 %\ifcase \month \or January\or February\or March\or April\or May\or June\or July\or August\or September\or October\or November\or December\fi,
 %\number \year} %显示英文日期

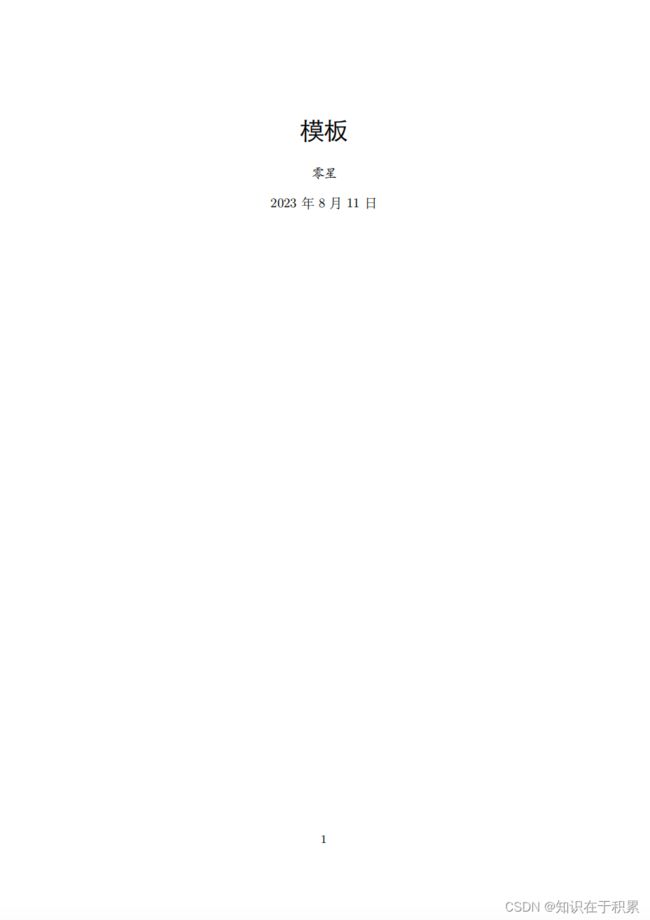
\title{\huge \heiti 模板}
\author{\kaishu 零星}
\date{\today}

%正文区(文稿区)
\begin{document}
 \maketitle
 \newpage

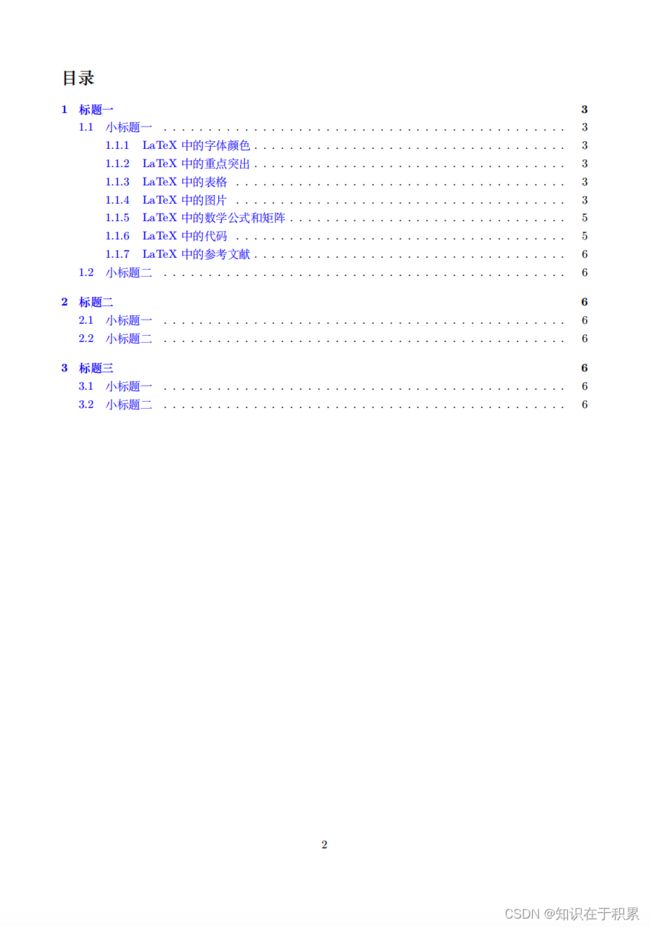
 \tableofcontents
 \newpage

 \section{标题一}
 \subsection{小标题一}
 \subsubsection{LaTeX中的字体颜色}
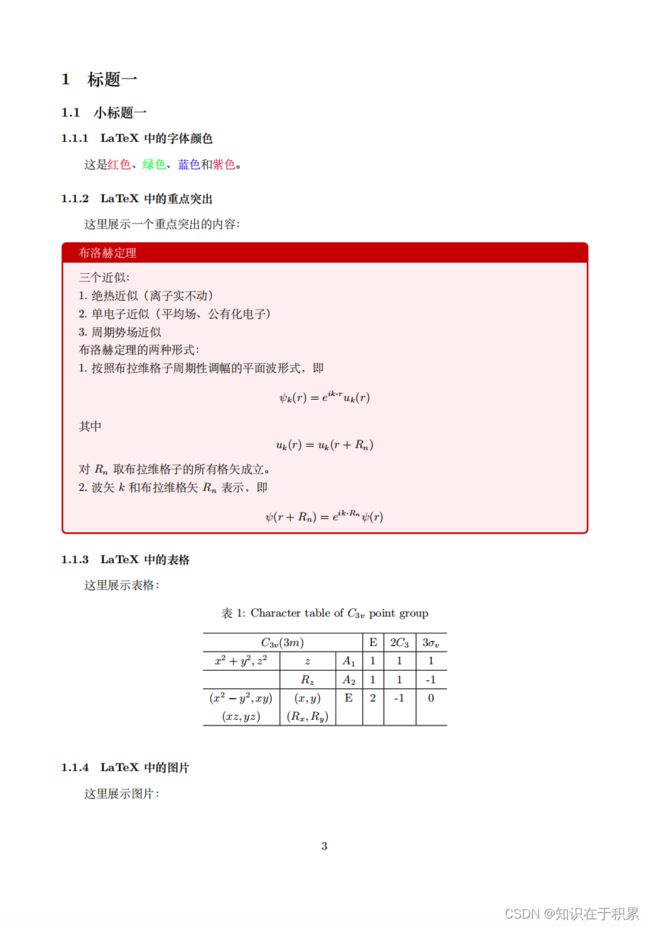
 这是{\color{red}红色}、{\color{green}绿色}、{\color{blue}蓝色}和{\color{purple}紫色}。

 \subsubsection{LaTeX中的重点突出}
 这里展示一个重点突出的内容:
  \begin{tcolorbox}[colback=red!5!white,colframe=red!75!black,title=布洛赫定理]
    三个近似:

    1.绝热近似(离子实不动)

    2.单电子近似(平均场、公有化电子)

    3.周期势场近似

    布洛赫定理的两种形式:

    1.按照布拉维格子周期性调幅的平面波形式,即
    $$\psi_k(r)=e^{ik\vdot r}u_k(r)$$
    其中
    $$u_k(r)=u_k(r+R_n)$$
    对$R_n$取布拉维格子的所有格矢成立。

    2.波矢$k$和布拉维格矢$R_n$表示,即
   $$\psi(r+R_n)=e^{ik\vdot R_n}\psi(r)$$

  \end{tcolorbox}

 \subsubsection{LaTeX中的表格}
 这里展示表格:
  \begin{table}[htbp]
   \centering
   \caption{Character table of $C_{3v}$ point group}\label{table1}
   \begin{tabular}{c | c | c | c | c | c}
    \hline
    \multicolumn{3}{c|}{$C_{3v}(3m)$} & E & $2C_3$ & $3\sigma_v$ \\
    \hline
    $x^2+y^2, z^2$ & $z$ & $A_1$ & 1 & 1 & 1\\
    \hline
    & $R_z$ & $A_2$ & 1 & 1 & -1\\
    \hline
    $(x^2-y^2,xy)$ & $(x, y)$ & E & 2 & -1 & 0\\
    $(xz, yz)$ & $(R_x, R_y)$ &  &  &  & \\
    \hline
   \end{tabular}
  \end{table}

 \subsubsection{LaTeX中的图片}
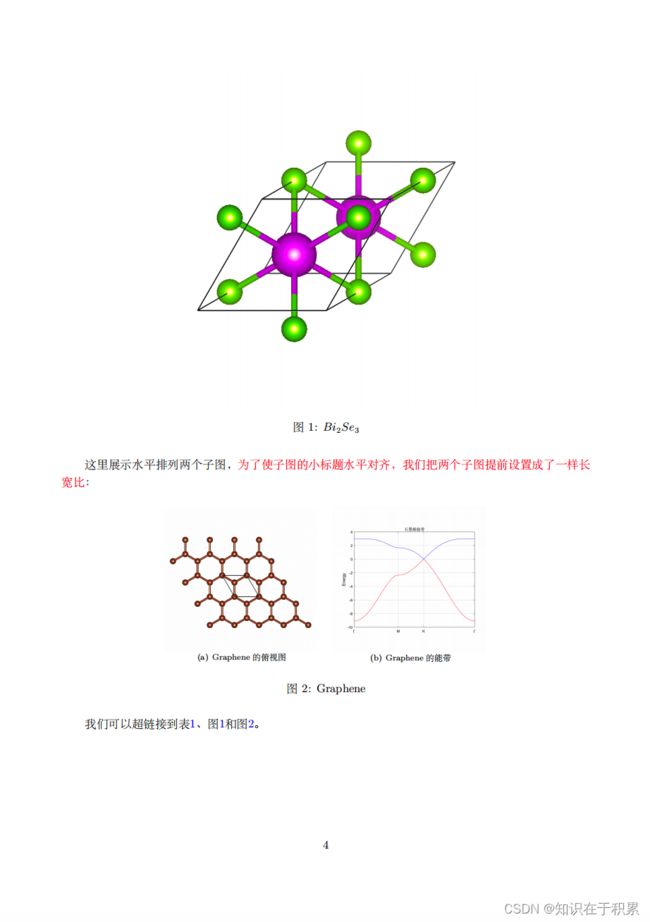
 这里展示图片:
  \begin{figure}[H]
   \centering
   \includegraphics[scale=0.8]{Bi2Se3}
   \caption{$Bi_2Se_3$}
   \label{fig1}
  \end{figure}

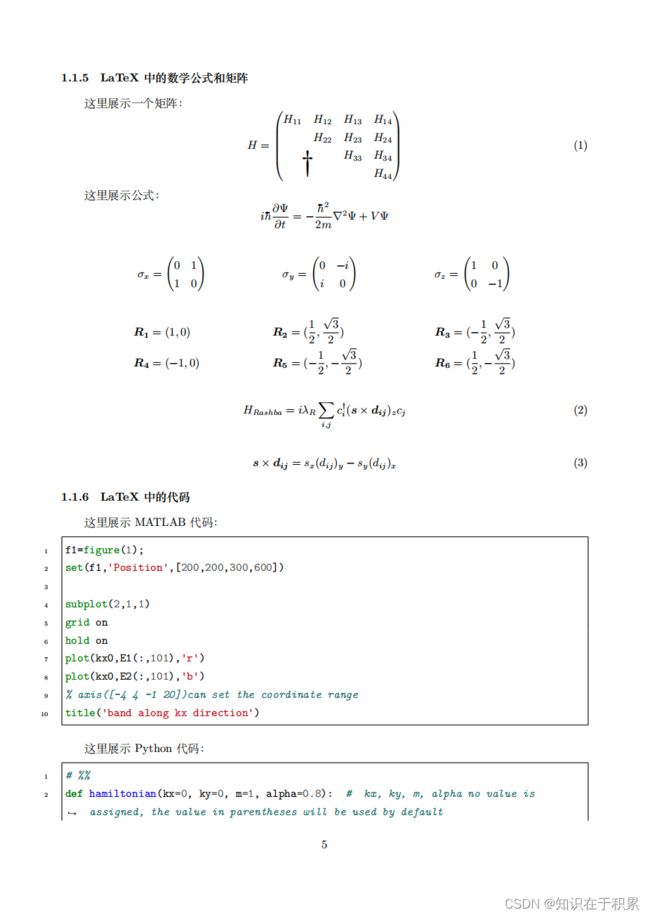
 这里展示水平排列两个子图,{\color{red}为了使子图的小标题水平对齐,我们把两个子图提前设置成了一样长宽比}:
  \begin{figure}[htbp]
   \centering
   \subfigure[Graphene的俯视图]{
    \begin{minipage}{5cm}
     \centering
     \includegraphics[scale=0.33]{Graphene}
     \label{t1}
    \end{minipage}
   }
   \subfigure[Graphene的能带]{
    \begin{minipage}{5cm}
     \centering
     \includegraphics[scale=0.33]{Graphene-band}
     \label{t2}
    \end{minipage}
   }
   \caption{Graphene}
   \label{fig2}
  \end{figure}

 我们可以超链接到表\ref{table1}、图\ref{fig1}和图\ref{fig2}。

 \subsubsection{LaTeX中的数学公式和矩阵}
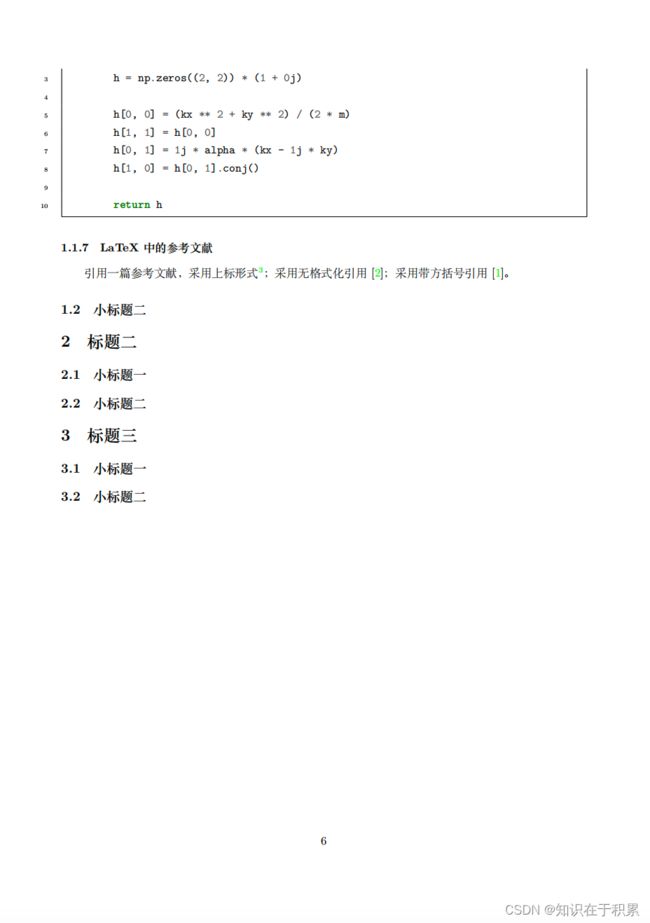
 这里展示一个矩阵:
  \begin{equation}
   H=\begin{pmatrix}
    H_{11} & H_{12} & H_{13} & H_{14} \\
    & H_{22} & H_{23} & H_{24} \\
    & & H_{33} & H_{34} \\
    \multicolumn{2}{c}{\raisebox{1.3ex}[0pt]{\Huge \dag}}& & H_{44}
   \end{pmatrix}
  \end{equation}

 这里展示公式:
 $$ i\hbar\pdv{\Psi}{t}=-\frac{\hbar^2}{2m}\laplacian{\Psi}+V\Psi $$

  \begin{align*}
   \sigma_x &=\begin{pmatrix}
    0 & 1 \\
    1 & 0 \\
   \end{pmatrix}&
   \sigma_y &=\begin{pmatrix}
    0 & -i \\
    i & 0
   \end{pmatrix}&
   \sigma_z &=\begin{pmatrix}
    1 & 0 \\
    0 & -1
   \end{pmatrix}
  \end{align*}

  \begin{align*}
   \boldsymbol{R_1}&=(1,0)& \boldsymbol{R_2}&=(\frac{1}{2},\frac{\sqrt{3}}{2})&  \boldsymbol{R_3}&=(-\frac{1}{2},\frac{\sqrt{3}}{2}) \\
   \boldsymbol{R_4}&=(-1,0)& \boldsymbol{R_5}&=(-\frac{1}{2},-\frac{\sqrt{3}}{2})&  \boldsymbol{R_6}&=(\frac{1}{2},-\frac{\sqrt{3}}{2})
  \end{align*}

  \begin{equation}
   H_{Rashba}=i\lambda_R\sum_{i,j}c_i^\dag (\boldsymbol{s}\times  \boldsymbol{d_{ij}})_zc_j
  \end{equation}

  \begin{align}
   \boldsymbol{s}\times \boldsymbol{d_{ij}}=s_x(d_{ij})_y-s_y(d_{ij})_x
  \end{align}

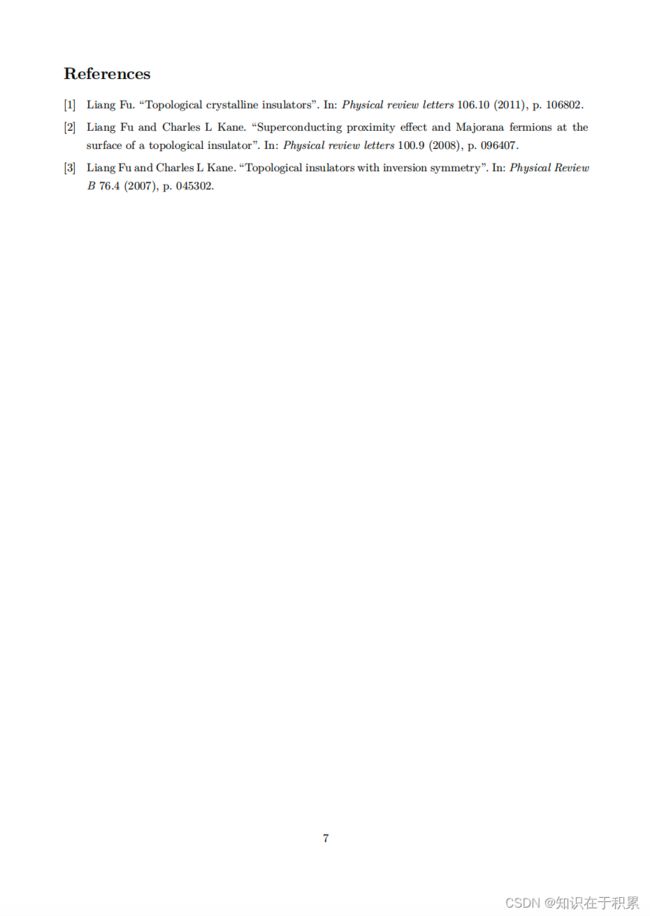
 \subsubsection{LaTeX中的代码}
 这里展示MATLAB代码:
  \begin{minted}[linenos=true, frame=single,breaklines]{matlab}
f1=figure(1);
set(f1,'Position',[200,200,300,600])

subplot(2,1,1)
grid on
hold on
plot(kx0,E1(:,101),'r')
plot(kx0,E2(:,101),'b')
% axis([-4 4 -1 20])can set the coordinate range
title('band along kx direction')
  \end{minted}

 这里展示Python代码:
  \begin{minted}[linenos=true, frame=single,breaklines]{python}
# %%
def hamiltonian(kx=0, ky=0, m=1, alpha=0.8):  #  kx, ky, m, alpha no value is assigned, the value in parentheses will be used by default
 h = np.zeros((2, 2)) * (1 + 0j)

 h[0, 0] = (kx ** 2 + ky ** 2) / (2 * m)
 h[1, 1] = h[0, 0]
 h[0, 1] = 1j * alpha * (kx - 1j * ky)
 h[1, 0] = h[0, 1].conj()

 return h
  \end{minted}

 \subsubsection{LaTeX中的参考文献}
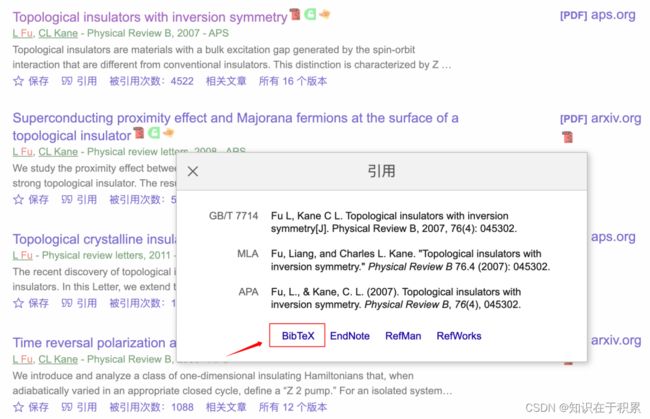
 引用一篇参考文献,采用上标形式\supercite{fu2007topological};采用无格式化引用\cite{fu2008superconducting};采用带方括号引用\parencite{fu2011topological}。

 \subsection{小标题二}

 \section{标题二}
 \subsection{小标题一}

 \subsection{小标题二}

 \section{标题三}
 \subsection{小标题一}

 \subsection{小标题二}

 \newpage
 \nocite{*}
 \printbibliography

\end{document}
