python绘制北极风场与位势高度场/python cartopy极地投影重叠问题解决
背景
python作为胶水语言,近年来在气象数据处理与可视化中有着极为广泛地应用,诸多第三方库极为便利地满足了气象研究者处理数据与绘图的要求,处理数据的包:xarray、pandas,读取不同气象格式的包:netcdf4、h5py,用于模式后处理的wrf-python、python-CDO等等。
同样,python在气象可视化方面也有着许多包,一般而言,python的气象绘图是用matplotlib包绘图,用Basemao或cartopy包绘制地图底图,结合绘制。
Basemao包在2020年已经停止维护,目前主要使用cartopy库绘制底图。
然而cartopy图存在一些奇怪的bug,尤其在使用极地投影时,会出现:等值线重叠扭曲、风矢量无法对应,坐标标签无法添加等诸多问题。
其中,极地投影坐标的添加在cartioy20.0+中已经获得解决,具体参见我之前的博文:cartopy20.0+解决python极地投影问题,,然而,新版的cartopy仍然未解决在绘制极地区域时等值线扭曲重叠的问题,经过我的找寻,终于在Github上找到了解决方法。
具体的解决方法可以见:Plotting curvilinear with wrapping issue: suggestion on how to do it,下面我将以自己的数据为例,给大家查看效果。
实例
解决该问题主要使用了函数,z_masked_overlap,该函数解决了极地投影绘制contour、contourf绘制重叠的问题。
在源代码下,使用cartopy绘制等值线与等值线填充会出现:
proj =ccrs.NorthPolarStereo(central_longitude=0)#设置地图投影
#在圆柱投影中proj = ccrs.PlateCarree(central_longitude=xx)
leftlon, rightlon, lowerlat, upperlat = (-180,180,60,90)#经纬度范围

img_extent = [leftlon, rightlon, lowerlat, upperlat]
fig1 = plt.figure(figsize=(12,10))#设置画布大小
f1_ax1 = fig1.add_axes([0.2, 0.3, 0.5, 0.5],projection = ccrs.NorthPolarStereo(central_longitude=0))#绘制地图位置
#注意此处添加了projection = ccrs.NorthPolarStereo(),指明该axes为北半球极地投影
#f1_ax1.gridlines(crs=ccrs.PlateCarree(), draw_labels=True,
 #                 linewidth=1, color='grey',linestyle='--')
f1_ax1.set_extent(img_extent, ccrs.PlateCarree())
f1_ax1.add_feature(cfeature.COASTLINE.with_scale('110m'))

g1=f1_ax1.gridlines(crs=ccrs.PlateCarree(), draw_labels=True, linewidth=1, color='gray',linestyle='--')
```g1.xlocator = mticker.FixedLocator(np.linspace(-180,180,13))
g1.ylocator = mticker.FixedLocator(np.linspace(60, 90,4))

theta = np.linspace(0, 2*np.pi, 100)
center, radius = [0.5, 0.5], 0.44
verts = np.vstack([np.sin(theta), np.cos(theta)]).T
circle = mpath.Path(verts * radius + center)
levels = np.arange(5000,5600,50)
f1_ax1.set_boundary(circle, transform=f1_ax1.transAxes)
c7=f1_ax1.contourf(lon2D,lat2D,mhtsp,transform=ccrs.PlateCarree(),cmap=cmaps.matlab_jet,levels=20,vmin=5000,vmax=5600)
quiver = f1_ax1.quiver(lon2D, lat2D, musp, mvsp, pivot='tail',width=0.002, scale=200, color='black', headwidth=4,
                       regrid_shape=25,alpha=1,transform=ccrs.PlateCarree())
f1_ax1.quiverkey(quiver, 0.91, 1.03, 5, "5m/s",labelpos='E', coordinates='axes', fontproperties={'size': 10,'family':'Times New Roman'})

plt.show()
绘图如下:
可以看到,中央部分出现奇怪的多边形,等值线填充不对,风场也分布不对,这正是由于cartopy本身对于极地投影坐标的一些重叠部分处理不对的问题。
然而,这个问题再引入Plotting curvilinear with wrapping issue: suggestion on how to do it中编写的z_masked_overlap函数便可以轻松解决:
import os
import matplotlib.ticker as mticker
import netCDF4 as nc
import matplotlib.path as mpath
import cmaps
import matplotlib.pyplot as plt###引入库包
import numpy as np
import numpy.ma as ma
import matplotlib as mpl
import cartopy.crs as ccrs
import cartopy.feature as cfeature
from netCDF4 import Dataset
try:
    import pykdtree.kdtree
    _IS_PYKDTREE = True
except ImportError:
    import scipy.spatial
    _IS_PYKDTREE = False
from wrf import getvar, interplevel, vertcross,vinterp, ALL_TIMES, CoordPair, xy_to_ll, ll_to_xy, to_np, get_cartopy, latlon_coords, cartopy_xlim, cartopy_ylim
from cartopy.mpl.gridliner import LONGITUDE_FORMATTER, LATITUDE_FORMATTER
filepath='F:/ERA5/met_em/'
```def z_masked_overlap(axe, X, Y, Z, source_projection=None):
    """
    for data in projection axe.projection
    find and mask the overlaps (more 1/2 the axe.projection range)

    X, Y either the coordinates in axe.projection or longitudes latitudes
    Z the data
    operation one of 'pcorlor', 'pcolormesh', 'countour', 'countourf'

    if source_projection is a geodetic CRS data is in geodetic coordinates
    and should first be projected in axe.projection

    X, Y are 2D same dimension as Z for contour and contourf
    same dimension as Z or with an extra row and column for pcolor
    and pcolormesh

    return ptx, pty, Z
    """
    if not hasattr(axe, 'projection'):
        return Z
    if not isinstance(axe.projection, ccrs.Projection):
        return Z

    if len(X.shape) != 2 or len(Y.shape) != 2:
        return Z

    if (source_projection is not None and
            isinstance(source_projection, ccrs.Geodetic)):
        transformed_pts = axe.projection.transform_points(
            source_projection, X, Y)
        ptx, pty = transformed_pts[..., 0], transformed_pts[..., 1]
    else:
        ptx, pty = X, Y


    with np.errstate(invalid='ignore'):
        # diagonals have one less row and one less columns
        diagonal0_lengths = np.hypot(
            ptx[1:, 1:] - ptx[:-1, :-1],
            pty[1:, 1:] - pty[:-1, :-1]
        )
        diagonal1_lengths = np.hypot(
            ptx[1:, :-1] - ptx[:-1, 1:],
            pty[1:, :-1] - pty[:-1, 1:]
        )
        to_mask = (
            (diagonal0_lengths > (
                abs(axe.projection.x_limits[1]
                    - axe.projection.x_limits[0])) / 2) |
            np.isnan(diagonal0_lengths) |
            (diagonal1_lengths > (
                abs(axe.projection.x_limits[1]
                    - axe.projection.x_limits[0])) / 2) |
            np.isnan(diagonal1_lengths)
        )

        # TODO check if we need to do something about surrounding vertices

        # add one extra colum and row for contour and contourf
        if (to_mask.shape[0] == Z.shape[0] - 1 and
                to_mask.shape[1] == Z.shape[1] - 1):
            to_mask_extended = np.zeros(Z.shape, dtype=bool)
            to_mask_extended[:-1, :-1] = to_mask
            to_mask_extended[-1, :] = to_mask_extended[-2, :]
            to_mask_extended[:, -1] = to_mask_extended[:, -2]
            to_mask = to_mask_extended
        if np.any(to_mask):

            Z_mask = getattr(Z, 'mask', None)
            to_mask = to_mask if Z_mask is None else to_mask | Z_mask

            Z = ma.masked_where(to_mask, Z)

        return ptx, pty, Z
        X, Y, masked_MDT = z_masked_overlap(
    f1_ax1, lon2D, lat2D, mhtsp,
    source_projection=ccrs.Geodetic())
   # mask the overlaps
f1_ax1.contour(X, Y, masked_MDT,
           colors="black",levels=20,linestyle='--')
c7=f1_ax1.contourf(X, Y, masked_MDT,
            levels=levels, cmap=cmaps.matlab_jet)
quiver = f1_ax1.quiver(X, Y, musp, mvsp, pivot='tail',width=0.002, scale=200, color='black', headwidth=4,
                       regrid_shape=30,alpha=1)
f1_ax1.quiverkey(quiver, 0.91, 1.03, 5, "5m/s",labelpos='E', coordinates='axes', fontproperties={'size': 10,'family':'Times New Roman'})
position=fig1.add_axes([0.2, 0.25, 0.5, 0.025])#图标位置

font = {'family' : 'serif',
        'color'  : 'darkred',
        'weight' : 'normal',
        'size'   : 16,
        }
cb=fig1.colorbar(c7,cax=position,orientation='horizontal',format='%.1f',extend='both')#设置图标
plt.show()
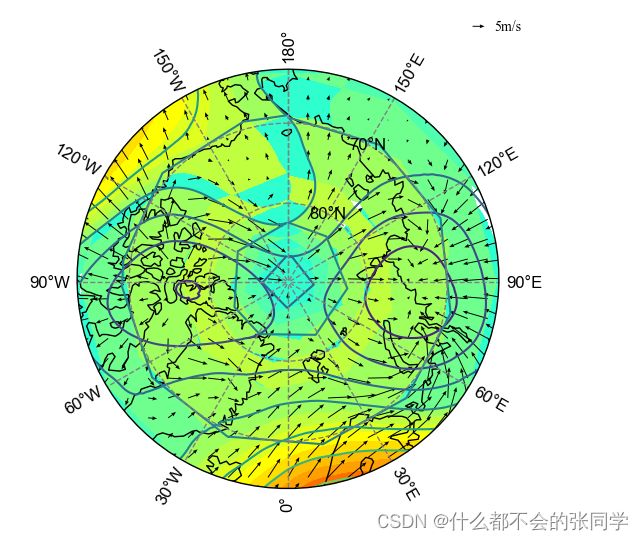
绘图:

可以看到,问题得到了较好地解决。