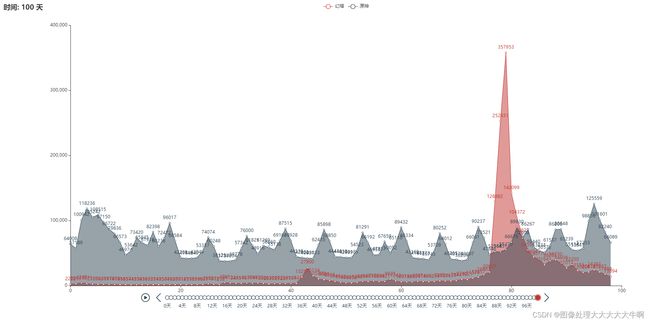
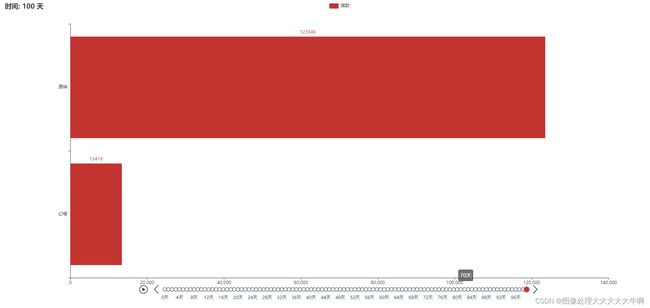
使用python动态可视化幻塔和原神近100天的热度
《原神》是一款扎实的游戏,略微受到免费模式限制妨碍。游戏总体价值很高,核心玩法没问题,尤其是元素互动系统非常有趣,个性很鲜明

《幻塔》是一款开放世界手游,借助高自由度探索玩法与沉浸式剧情演出,为你讲述一段有关拯救与毁灭的末世故事

通过抓取百度指数 对比了100天的热度变化,我得出一个结论,完美世界就是昙花一现,不过不能否认的是潜力还是很大的。
进入干货环节
爬取百度指数
import requests
import sys
import time

word_url = 'http://index.baidu.com/api/SearchApi/thumbnail?area=0&word={}'
COOKIES = ''
headers = {
    'Accept': 'application/json, text/plain, */*',
    'Accept-Encoding': 'gzip, deflate',
    'Accept-Language': 'zh-CN,zh;q=0.9',
    'Cache-Control': 'no-cache',
    'Cookie': COOKIES,
    'DNT': '1',
    'Host': 'index.baidu.com',
    'Pragma': 'no-cache',
    'Proxy-Connection': 'keep-alive',
    'Referer': 'http://index.baidu.com/v2/main/index.html',
    'User-Agent': 'Mozilla/5.0 (Macintosh; Intel Mac OS X 10_13_6) AppleWebKit/537.36 (KHTML, like Gecko) Chrome/75.0.3770.90 Safari/537.36',
    'X-Requested-With': 'XMLHttpRequest',
}


def decrypt(t,e):
    n = list(t)
    i = list(e)
    a = {}
    result = []
    ln = int(len(n)/2)
    start = n[ln:]
    end = n[:ln]
    for j,k in zip(start, end):
        a.update({k: j})
    for j in e:
        result.append(a.get(j))
    return ''.join(result)


def get_ptbk(uniqid):
    url = 'http://index.baidu.com/Interface/ptbk?uniqid={}'
    resp = requests.get(url.format(uniqid), headers=headers)
    if resp.status_code != 200:
        print('获取uniqid失败')
        sys.exit(1)
    return resp.json().get('data')


def get_index_data(keyword, start='2021-12-01', end='2022-01-06'):
    keyword = str(keyword).replace("'", '"')
    url = f'http://index.baidu.com/api/SearchApi/index?area=0&word={keyword}&area=0&startDate={start}&endDate={end}'

    resp = requests.get(url, headers=headers)
    if resp.status_code != 200:
        print('获取指数失败')
        sys.exit(1)

    content = resp.json()
    data = content.get('data')
    user_indexes = data.get('userIndexes')[0]
    uniqid = data.get('uniqid')
    ptbk = get_ptbk(uniqid)

    while ptbk is None or ptbk == '':
        ptbk = get_ptbk(uniqid)

    all_data = user_indexes.get('all').get('data')
    result = decrypt(ptbk, all_data)
    result = result.split(',')

    print(result)
    print(len(result))
    return result


if __name__ == '__main__':
    words = [[{"name": "原神", "wordType": 1}]]
    get_index_data(words)
解析出数据
然后使用pyecharts进行可视化
from pyecharts import options as opts
from pyecharts.charts import Bar, Timeline,Line
from pyecharts.faker import Faker
import random
from IndexLive import *
import numpy as np


def get_data(keys,start,end,space = 1):
    data = np.array([ get_index_data([[{"name": "%s"%k, "wordType": 1}]],start,end) for k in keys])
    if space==1:
        return data
    row,col = data.shape
    data_tmp = np.array([])
    for i in range(col-1):
        tmp = data[:,i:i+2]
        row_t = np.array([])
        for a,b in tmp:
            a,b = float(a),float(b)
            row_t = np.append(row_t,np.linspace(a,b,space))
        row_t = np.reshape(row_t,(row,space))
        if data_tmp.size!=0:
            data_tmp = np.hstack((data_tmp,row_t))
        else:
            data_tmp = row_t
    return data_tmp

def 横向柱状图(start,end,space):
    d1,d2 = get_data(["幻塔","原神"],start,end,space)
    tl = Timeline()
    tl.add_schema(is_auto_play = True,
    play_interval = 100,
    is_loop_play = False)

    for i in range(len(d1)):
        bar = (
            Bar()
            .add_xaxis(["幻塔","原神"])
            .add_yaxis("指数", [d1[i],d2[i]])
            .reversal_axis()
            .set_global_opts(title_opts=opts.TitleOpts("时间: {} 天".format(i+1)))


        )
        tl.add(bar, "{}天".format(i))
    tl.render("timeline_bar_reversal.html")

def 对数轴(start,end,space):
    d1,d2 = get_data(["幻塔","原神"],start,end,space)
    tl = Timeline()
    tl.add_schema(is_auto_play = True,
    play_interval = 100,
    is_loop_play = False)

    xaxis_data = [x for x in range(len(d1))]

    dd = np.array([])
    for xa in xaxis_data:
        dd=np.append(dd,np.linspace(xa,xa+1,space))
    for i in range(len(d1)):
        line = (
            Line()
            .add_xaxis(dd)
            .add_yaxis("幻塔", d1[0:i], areastyle_opts=opts.AreaStyleOpts(opacity=0.5),)
            .add_yaxis("原神", d2[0:i], areastyle_opts=opts.AreaStyleOpts(opacity=0.5),)
            .set_global_opts(title_opts=opts.TitleOpts("时间: {} 天".format(i+1)))

        )
        tl.add(line, "{}天".format(i))
    tl.render("timeline_line_reversal.html")

if __name__=='__main__':
    space = 1
    start='2021-09-28'
    end='2022-01-06'
    对数轴(start,end,space)
    横向柱状图(start,end,space)


