R可视乎|灯芯柱状图代码解读
简介
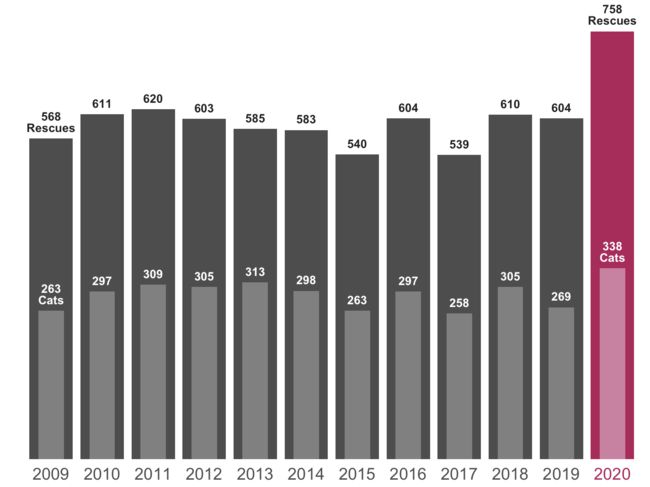
这篇推文代码来源于:TidyTuesday,主要想学习如何绘制灯芯柱状图(名字小编瞎取的),最终结果如下:
注释:与普通柱状图相比,灯芯柱状图不仅可以展示随时间变化的总体趋势(图中黑色柱子 “Rescues”),而且能够清晰展示灯芯内部数据(图中浅灰色柱子 “cats”)相对于总体的比例随时间的变化。
看到最终成品,读者是否可以根据自己所学知识,回答以下几个问题:
-
如何实现两个柱状图嵌套?
-
如何使得2020年份数据单独显示为粉色?
-
如何在柱状图上方添加文字,其中一些文字包括其他单词?
接下来,小编带你解读源代码,并回答以上问题。读者可以根据这些知识要点,灵活应用到其他图形中。
数据介绍
从文件 animal_rescues.txt 中读取数据,并对数据进行预处理,包括分类汇总和计数。
注意:由于时间和文章篇幅原因,数据处理部分不做过多介绍。读者可以根据格式,使用自己比较感兴趣的数据。
library(tidyverse)
library(ggtext)
library(ggrepel)
library(patchwork)
library(systemfonts)
# 数据读取+处理 ========
df_animals <- readr::read_csv('animal_rescues.txt')

df_animals_agg <-
  df_animals %>%
  mutate(
    animal_group_aggregated = case_when(
      str_detect(animal_group_parent, "Domestic|Livestock|Farm|Horse|Cow|Sheep|Goat|Lamb|Bull") ~ "Other Domestic Animals",
      animal_group_parent %in% c("Cat", "cat") ~ "Cats",
      animal_group_parent %in% c("Bird", "Budgie") ~ "Birds",
      animal_group_parent == "Dog" ~ "Dogs",
      animal_group_parent == "Fox" ~ "Foxes",
      TRUE ~ "Other Wild Animals"
    )
  ) %>%
  count(cal_year, animal_group_aggregated) %>%
  group_by(animal_group_aggregated) %>%
  mutate(
    total = sum(n),
    current = n[which(cal_year == 2021)]
  ) %>%
  ungroup() %>%
  mutate(
    animal_group_aggregated = fct_reorder(animal_group_aggregated, total),
    animal_group_aggregated = fct_relevel(animal_group_aggregated, "Other Domestic Animals", after = 0),
    animal_group_aggregated = fct_relevel(animal_group_aggregated, "Other Wild Animals", after = 0)
  )

df_animals_labs <-
  df_animals_agg %>%
  filter(cal_year == 2016) %>%
  group_by(animal_group_aggregated) %>%
  mutate(n = case_when(
    animal_group_aggregated == "Cats" ~ 320,
    animal_group_aggregated %in% c("Birds", "Dogs") ~ 135,
    TRUE ~ 55
  ))

df_animals_annotate <-
  df_animals_agg %>%
  mutate(label = "\n\n← Number of Rescues in 2021 so far.") %>%
  filter(cal_year == 2021 & animal_group_aggregated == "Cats")

df_animals_sum <-
  df_animals_agg %>%
  filter(cal_year < 2021) %>%
  group_by(cal_year) %>%
  summarize(n = sum(n))
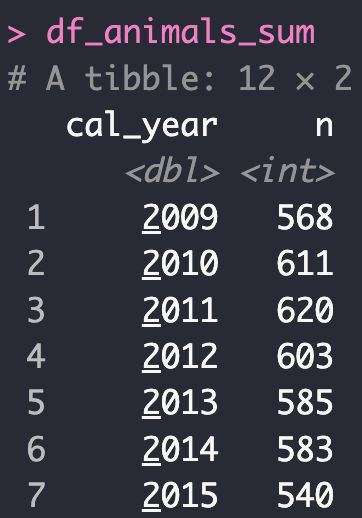
绘图主要使用 df_animals_sum,以下是该数据预览:
画图
绘图代码使用了 R 中的多个包(tidyverse, ggtext, ggrepel, patchwork, systemfonts)来创建一个特定风格的统计图表。以下是代码的主要步骤和功能:
设置主题和风格:
设置基础主题为 theme_minimal,指定了基本字体大小和字体家族。使用 theme_update 对不同图表元素进行自定义,包括文本样式、轴样式、网格线样式等。
# 主题设置 ======
theme_set(theme_minimal(base_size = 19))
# 自定义主题细节
theme_update(
  text = element_text(color = "grey12"),
  axis.title = element_blank(),
  axis.text.x = element_text(),
  axis.text.y = element_blank(),
  panel.grid.major.y = element_blank(),
  panel.grid.minor = element_blank(),
  plot.margin = margin(20, 5, 10, 10),
  plot.subtitle = element_textbox_simple(size = 14, lineheight = 1.6),
  plot.title.position = "plot",
  plot.caption = element_text( color = "#b40059", hjust = .5, size = 10, margin = margin(35, 0, 0, 0))
)
数据可视化
为了更好解读代码中的细节部分,小编将代码进行分解,一步步展示细节内容。完整绘图代码见文末,或者可以在我的 Github 中找到源代码和数据。
- 创建一个柱状图 (
geom_col) 表示不同年份的动物救援数量。
  df_animals_sum %>%
  ggplot(aes(cal_year, n)) +
  geom_col(aes(fill = factor(cal_year)), width = .85)
- 再添加一个柱状图,指定
data和fill参数,并通过修改width实现嵌套。这里数据进行过滤,选择 2021 年前数据,并且选择animal_group_aggregated == "Cats"。另一个细节:alpha = cal_year == 2020透明度根据是否cal_year==2000进行设置。 如果是则 fill = “white”。
geom_col(
    data = df_animals_agg %>% filter(animal_group_aggregated == "Cats" & cal_year < 2021),
    aes(alpha = cal_year == 2020), # 这里有细节!
    fill = "white", width = .5 # 宽度和透明度设置
  )
加入该代码后,绘图结果为:
- 使用
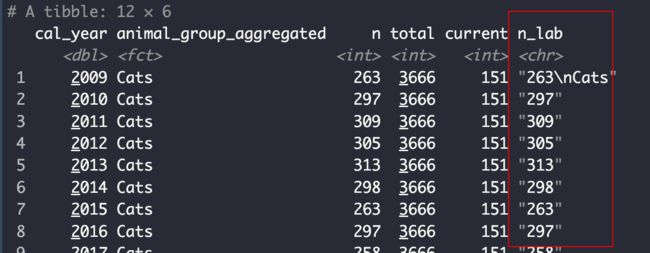
geom_text在图上添加文本标签。对数据进行处理,添加新列文本数据,实现添加其他文字。df_animals_sum %>% mutate(n_lab = if_else(cal_year %in% c(2009, 2020), paste0(n, "\nRescues"), as.character(n)))

  geom_text( #添加文本+加入rescues
    data = df_animals_sum %>%
      mutate(n_lab = if_else(cal_year %in% c(2009, 2020), paste0(n, "\nRescues"), as.character(n))),
    aes(label = n_lab), size = 4.3, lineheight = .8,
    nudge_y = 12, vjust = 0, color = "grey12", fontface = "bold"
  ) +
  geom_text( #添加文本+加入cats
    data = df_animals_agg %>% filter(animal_group_aggregated == "Cats" & cal_year < 2021) %>%
      mutate(n_lab = if_else(cal_year %in% c(2009, 2020), paste0(n, "\nCats"), as.character(n))),
    aes(label = n_lab),
    color = "white", lineheight = .8, size = 4.3,
    nudge_y = 12, vjust = 0, fontface = "bold"
  ) +
  geom_text( # 手动添加年份标签
    data = df_animals_agg %>% filter(animal_group_aggregated == "Cats" & cal_year < 2021),
    aes(y = -15, label = cal_year, color = factor(cal_year)),
    size = 6, hjust = .5, vjust = 1
  )
- 调整图表样式:自定义图表的标题、副标题、图例等元素的样式。通过
scale_fill_manual(values = c(rep("grey30", 11), "#b40059"), guide = "none")实现手动颜色填充,突出 2020 年数据。
  coord_cartesian(clip = "off") +
  scale_y_continuous(limits = c(-15, NA)) +
  scale_color_manual(values = c(rep("grey30", 11), "#b40059"), guide = "none") +
  scale_fill_manual(values = c(rep("grey30", 11), "#b40059"), guide = "none") +
  scale_alpha_manual(values = c(.25, .4), guide = "none") +
  theme(
    # plot.title = element_markdown(size = 28, margin = margin(5, 35, 25, 35), color = "black"),
    # plot.subtitle = element_textbox_simple(margin = margin(5, 35, 15, 35)),
    panel.grid.major = element_blank(),
    axis.text.x = element_blank()
  )
绘图完整代码
   df_animals_sum %>%
  ggplot(aes(cal_year, n)) +
  geom_col(aes(fill = factor(cal_year)), width = .85) +
  geom_col(
    data = df_animals_agg %>% filter(animal_group_aggregated == "Cats" & cal_year < 2021),
    aes(alpha = cal_year == 2020), # 这里有细节!
    fill = "white", width = .5 # 宽度和透明度设置
  ) +
  geom_text( #这里的数据处理:添加文本+加入rescues
    data = df_animals_sum %>%
      mutate(n_lab = if_else(cal_year %in% c(2009, 2020), paste0(n, "\nRescues"), as.character(n))),
    aes(label = n_lab), size = 4.3, lineheight = .8,
    nudge_y = 12, vjust = 0, color = "grey12", fontface = "bold"
  ) +
  geom_text( #添加文本+加入cats
    data = df_animals_agg %>% filter(animal_group_aggregated == "Cats" & cal_year < 2021) %>%
      mutate(n_lab = if_else(cal_year %in% c(2009, 2020), paste0(n, "\nCats"), as.character(n))),
    aes(label = n_lab),
    color = "white", lineheight = .8, size = 4.3,
    nudge_y = 12, vjust = 0, fontface = "bold"
  ) +
  geom_text( # 手动添加年份标签
    data = df_animals_agg %>% filter(animal_group_aggregated == "Cats" & cal_year < 2021),
    aes(y = -15, label = cal_year, color = factor(cal_year)),
    size = 6, hjust = .5, vjust = 1
  ) +
  coord_cartesian(clip = "off") +
  scale_y_continuous(limits = c(-15, NA)) +
  scale_color_manual(values = c(rep("grey30", 11), "#b40059"), guide = "none") +
  scale_fill_manual(values = c(rep("grey30", 11), "#b40059"), guide = "none") +
  scale_alpha_manual(values = c(.25, .4), guide = "none") +
  theme(
    # plot.title = element_markdown(size = 28, margin = margin(5, 35, 25, 35), color = "black"),
    # plot.subtitle = element_textbox_simple(margin = margin(5, 35, 15, 35)),
    panel.grid.major = element_blank(),
    axis.text.x = element_blank()
  )


