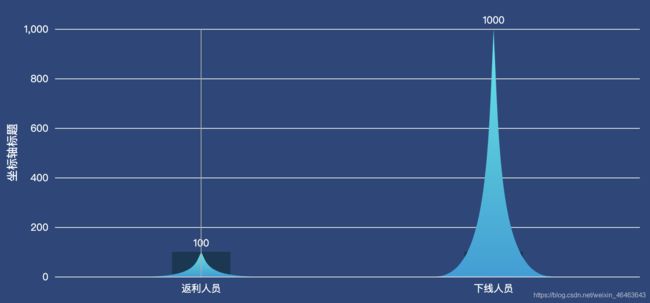
echarts 三角形柱状图
var xdata = ['返利人员', '下线人员']
var data = [100, 1000]
var maxArr = [100, 100]
options: {
        backgroundColor: '#28467c', // 背景色
        tooltip: {
          trigger: 'axis',
          borderRadius: 5,
          borderColor: '#fff',
          borderWidth: 1,
          formatter: function (params) {
            // 滑动每一条数据对应的数据 params
            return params[0].axisValue + '
' + '人员统计 :' + params[0].value
          }
        },
        grid: {
          left: 40,
          right: '3%',
          bottom: 20,
          top: '15%',
          containLabel: true
        },
        xAxis: {
          data: xdata,
          triggerEvent: true,
          axisTick: {
            // 刻度线
            show: false
          },
          axisLine: {
            show: false
          },
          axisLabel: {
            show: true,
            rotate: 0,
            interval: 0,
            textStyle: {
              color: '#fff'
            }
          }
        },
        yAxis: {
          name: '坐标轴标题',
          nameLocation: 'middle',
          triggerEvent: true,
          nameTextStyle: {
            padding: 30,
            fontSize: 14,
            color: '#fff'
          },
          splitLine: {
            show: true,
            lineStyle: {
              color: '#e5e5e5'
            }
          },
          axisTick: {
            show: false
          },
          axisLine: {
            show: false
          },
          axisLabel: {
            // y轴线
            show: true,
            textStyle: {
              color: '#fff',
              fontSize: 12
            }
          }
        },
        series: [
          {
            name: 'hill',
            barMinHeight: 10,
            type: 'pictorialBar',
            barCategoryGap: '60%',
            symbol:
              'path://M0,10 L10,10 C5.5,10 5.5,5 5,0 C4.5,5 4.5,10 0,10 z',
            itemStyle: {
              normal: {
                // 渐变色
                color: new echarts.graphic.LinearGradient(0, 0, 0, 1, [
                  {
                    offset: 0,
                    color: '#01EAED'
                  },
                  {
                    offset: 0.5,
                    color: '#02C4DD'
                  },
                  {
                    offset: 1,
                    color: '#029ED9'
                  }
                ])
              }
            },
            label: {
              // 数据上方显示数值
              show: true,
              position: 'top',
              textStyle: {
                color: '#fff',
                fontSize: 12
              }
            },
            data: data,
            z: 10
          },
          {
            // 阴影部分
            name: 'hill',
            type: 'bar',
            barWidth: '20%',
            symbol:
              'path://M0,10 L10,10 C5.5,10 5.5,5 5,0 C4.5,5 4.5,10 0,10 z',
            itemStyle: {
              normal: {
                color: 'rgba(11,47,68,.8)'
              }
            },
            data: maxArr,
            z: 9
          }
        ]
      }
