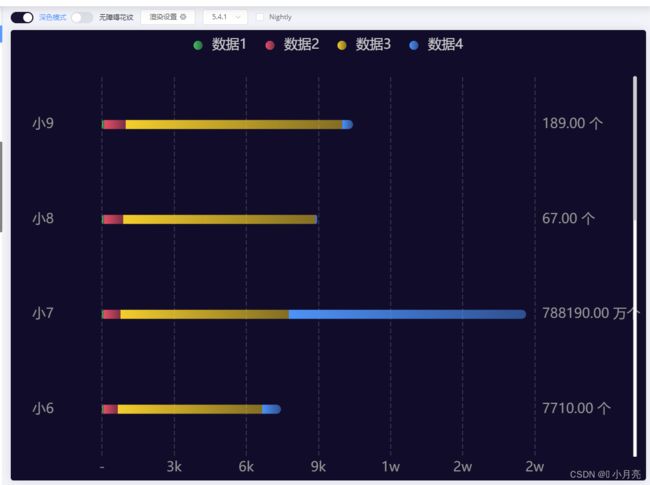
代码(直接复制到官网中的例子链接即可查看效果):
function accuracyCalc (value, conversion, accuracy) {
let resVal = ''
if (value) {
resVal = (parseFloat(value) * conversion).toFixed(accuracy)
}
return resVal
}
let yData = ['小1','小22','小333','小4444','小55555','小6','小7','小8','小9']
let yDataRight = [1310, 2310, 3310, 4310, 56789, 7710, 788190, 67, 189]
let seriesData = []
const legendData = ['数据1', '数据2', '数据3', '数据4']
const color = ['#2FC25B', '#EF4864', '#FACC14', '#3295FA']
const colorLinear = [
'rgba(47, 194, 91,0.5)',
'rgba(239, 72, 100,0.5)',
'rgba(250, 204, 20,0.5)',
'rgba(50, 149, 250,0.5)'
]
const valueData = [
{
name: '数据1',
data: [10,20, 30, 40, 50, 60, 70, 80 ,90]
},
{
name: '数据2',
data: [100, 200, 300, 400, 500, 600, 700, 800, 900]
},
{
name: '数据3',
data: [1000, 2000, 3000, 4000, 5000, 6000, 7000, 8000, 9000]
},
{
name: '数据4',
data: [200, 30, 40, 88, 96, 789, 9870, 76, 456]
}
]
for (let i = 0; i < valueData.length; i++) {
const item = valueData[i]
const obj = {
name: item.name,
type: 'bar',
barWidth: 16,
stack: 'total',
label: {
show: false
},
tooltip: {
},
itemStyle: {
color: new echarts.graphic.LinearGradient(0, 0, 1, 0, [
{ offset: 0, color: color[i] },
{ offset: 1, color: colorLinear[i] }
]),
borderRadius:
i === 0
? [100, 0, 0, 100]
: i === valueData.length - 1
? [0, 100, 100, 0]
: [0, 0, 0, 0]
},
data: item.data
}
seriesData.push(obj)
}
option = {
tooltip: {
trigger: 'axis',
axisPointer: {
type: 'shadow'
},
textStyle: {
fontSize: 24
},
confine: true
},
dataZoom: [
{
id: 'dataZoomY',
yAxisIndex: [0, 1],
show: true,
type: 'slider',
start: 100,
width: 6,
borderColor: 'transparent',
fillerColor: 'rgba(205,205,205,1)',
zoomLock: true,
showDataShadow: false,
backgroundColor: '#fff',
showDetail: false,
realtime: true,
filterMode: 'filter',
handleIcon: 'circle',
handleStyle: {
color: 'rgba(205,205,205,1)',
borderColor: 'rgba(205,205,205,1)'
},
handleSize: '80%',
moveHandleSize: 0,
maxValueSpan: 3,
minValueSpan: 3,
brushSelect: false
},
{
type: 'inside',
yAxisIndex: [0, 1],
start: 0,
zoomOnMouseWheel: false,
moveOnMouseMove: true,
moveOnMouseWheel: true
}
],
legend: {
data: legendData,
icon: 'circle',
itemGap: 32,
itemWidth: 16,
itemHeight: 16,
borderRadius: 16,
textStyle: {
width: 96,
padding: [0, 0, 0, 12],
fontSize: 24,
color: '#ccc'
}
},
grid: {
top: 73,
left: 100,
bottom: 0,
right: 0,
containLabel: true
},
xAxis: {
type: 'value',
showMinLabel: true,
showMaxLabel: true,
axisLabel: {
fontSize: 24,
color: '#999',
formatter: function (value) {
const equalVal = value
? (Math.abs(parseFloat(value)) > 1000) && (Math.abs(parseFloat(value)) < 10000)
? accuracyCalc(value, 0.001, 0) + 'k'
: Math.abs(parseFloat(value)) >= 10000
? accuracyCalc(value, 0.0001, 0) + 'w'
: parseFloat(value)
: '-'
return equalVal
}
},
splitLine: {
show: true,
lineStyle: {
type: 'dashed',
width: 2,
color: ['rgba(255,255,255,0.15)']
}
}
},
yAxis: [
{
type: 'category',
offset: 110,
axisLabel: {
fontSize: 24,
color: '#999',
margin: 13,
align: 'left',
formatter: (val) => {
return (val && val.length) > 4 ? val.slice(0, 4) + '...' : val
}
},
splitLine: {
show: false
},
axisLine: {
show: false
},
axisTick: {
show: false
},
data: yData
},
{
type: 'category',
yAxisIndex: 1,
axisLabel: {
fontSize: 24,
color: '#999',
margin: 13,
formatter: (value) => {
const equalVal = value
? Math.abs(parseFloat) >= 10000
? accuracyCalc(value, 0.0001, 2)
: parseFloat(value).toFixed(2)
: '-'
const unit = value
? Math.abs(parseFloat(value)) >= 10000
? ' 万个'
: ' 个'
: ' 个'
return equalVal + unit
}
},
splitLine: {
show: false
},
axisLine: {
show: false
},
axisTick: {
show: false
},
data: yDataRight
}
],
series: seriesData
}
效果图:

