Mental相关性网路图 | 环形网路图 | 二分式网路图
相关性网络图
date: 2023.10.12
教程收集与整理: 小杜的生信笔记
一边学习,一边总结,一边分享!
本期教程图形
![]()
写在前面
相关性分析,在前期教程中也有提及。但是使用R语言绘制相关性网络图,除了使用ggcor包做Meantal分析外,就没有类似的教程。本期教程,自己也收集相关的包和教程,分别绘制对应的图形。本期教程,也是值得大家收藏,现在的代码基本是直接粘贴复制即可。
1 安装和加载相关的R包
library(ggraph)
library(tidygraph)
# install.packages("devtools")
#devtools::install_github("Hy4m/linkET", force = TRUE)
library("linkET")
packageVersion("linkET")
packageVersion("igraph")
#devtools::install_github("Hy4m/netET")
library(netET)
设置路径
setwd("E:\\小杜的生信筆記\\2023\\20231012-mental分析网络图")
2 加载数据
matrix_data(list(mtcars = mtcars))

matrix_data(list(mtcars = mtcars)) %>%
  as_md_tbl()

as_matrix_data(mtcars)

head(mtcars)
3 计算r值和p值
as_md_tbl(mtcars)

correlate(mtcars) %>%
  as_md_tbl()
4 绘图
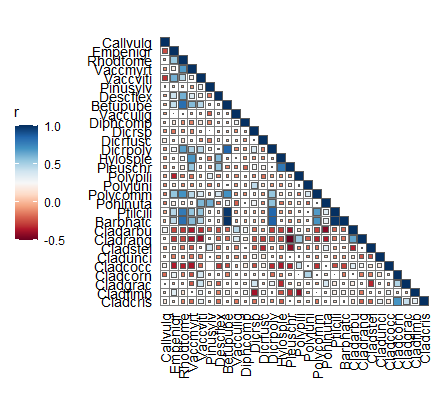
4.1 绘制组内相关性热图
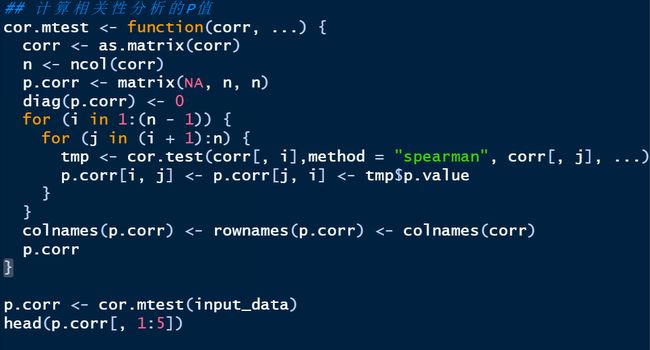
组内相关性分析,我们在前面的教程重要发表过,详情可以看R语言可视化-精美图形绘制系列–组内相关性分析。我们也提供完整的输出P值和cor值的代码。
correlate(mtcars) %>%
  as_md_tbl() %>%
  qcorrplot() +
  geom_square()
前期教程代码,计算组内相关性
library(reshape2)
library(corrplot)
library(plyr)
library(igraph)
library(autoReg)
library(tidyverse)
library(ggsci)
library(stats)

## 详情可以到此教程中查看
corr <- cor(mtcars, method = "spearman")
corrplot(corr,title = "",
         method = "circle", #或"circle" (default), "square", "ellipse", "number", "pie", "shade" and "color"
         outline = T,
         addgrid.col = "darkgray",
         order="hclust", addrect = 4, #hclust聚为4类,根据数据的具体情况调整
         mar = c(4,0,4,0),
         rect.col = "black", rect.lwd = 2, cl.pos = "b",
         tl.col = "black", tl.cex = 1, cl.cex = 1.5, tl.srt=60)
corrplot(corr,order = "AOE",type="upper",tl.pos = "tp")
corrplot(corr, title = "",
         method = "number",
         outline = T,
         add = TRUE, type = "lower",
         order="AOE",
         # col="black",
         # diag=FALSE,
         tl.pos="n", cl.pos="n")

## 注意:此步骤在R MarkDown格式中运行报错,但在非R MarkDown格式中可以正常运行
4.1 绘制组间相关热图
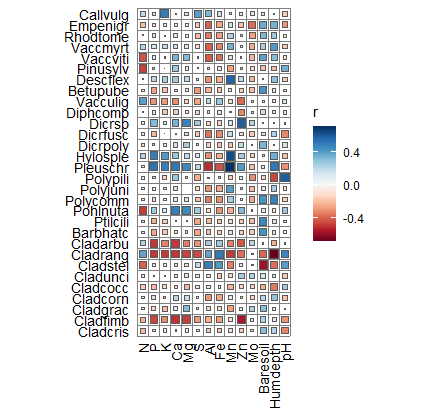
同样组内相关分析分析,在前期教程中也发布过。详情请看R语言可视化-精美图形绘制系列–组间相关性分析。
4.2.1 加载数据
首先,使用教程中的代码进行计算,运行。
library(vegan)
data("varespec")
data("varechem")
dim(varespec)
varespec[1:10,1:10]
查看数据
dim(varechem)
varechem[1:10,1:10]
4.2.2 计算两数据的相关性
绘制相关性热图
correlate(varespec[1:30], varechem) %>%
  qcorrplot() +
  geom_square() +
  scale_fill_gradientn(colours = RColorBrewer::brewer.pal(11, "RdBu"))
qcorrplot(varespec[1:30], type = "lower") +
  geom_square() +
  scale_fill_gradientn(colours = RColorBrewer::brewer.pal(11, "RdBu"))
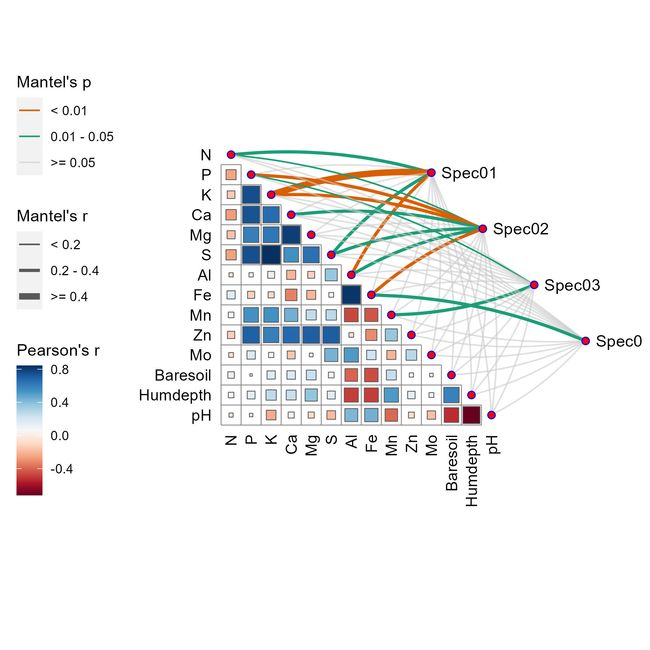
5 进行mantel分析
mantel相关性分析,早期教程ggcor包作图 | 相关性热图 | mental分析图。
那么使用linkET包,也是非常的方便。
5.1 加载数据
##mantel test
library(dplyr)

data("varechem", package = "vegan")
data("varespec", package = "vegan")
5.2 查看数据
## 查看数据
dim(varespec)
# [1] 24 44
varespec[1:10,1:10]
dim(varechem)
# [1] 24 14
varechem[1:10,1:10]
5.3 计算网络关系
mantel <- mantel_test(varespec,   ## 分类数据
                      varechem,  ## 影响因子数据
                      ## 以下代码是根据varespec(分类数据)进行分析计算
                      spec_select = list(Spec01 = 1:7,
                                         Spec02 = 8:18,
                                         Spec03 = 19:37,
                                         Spec04 = 38:44)) %>%
  mutate(rd = cut(r, breaks = c(-Inf, 0.2, 0.4, Inf),
                  labels = c("< 0.2", "0.2 - 0.4", ">= 0.4")),
         pd = cut(p, breaks = c(-Inf, 0.01, 0.05, Inf),
                  labels = c("< 0.01", "0.01 - 0.05", ">= 0.05")))
查看数据
head(mantel)
###
> head(mantel)
# A tibble: 6 × 6
  spec   env        r     p rd        pd

1 Spec01 N     0.256  0.015 0.2 - 0.4 0.01 - 0.05
2 Spec01 P     0.137  0.093 < 0.2     >= 0.05
3 Spec01 K     0.400  0.004 >= 0.4    < 0.01
4 Spec01 Ca    0.0113 0.427 < 0.2     >= 0.05
5 Spec01 Mg    0.0263 0.366 < 0.2     >= 0.05
6 Spec01 S     0.275  0.021 0.2 - 0.4 0.01 - 0.05
5.3 绘制mantel分析图
## 绘制相关性热图
D0 <- qcorrplot(correlate(varechem), type = "lower", diag = FALSE) +
  geom_square() +   ## 相关性热图的形状
  ##
  geom_couple(aes(colour = pd, size = rd),
              data = mantel,
              curvature = nice_curvature()) +
  ## 颜色参数调整
  scale_fill_gradientn(colours = RColorBrewer::brewer.pal(11, "RdBu")) +
  scale_size_manual(values = c(0.5, 1, 2)) +
  scale_colour_manual(values = color_pal(3)) +
  guides(size = guide_legend(title = "Mantel's r",
                             override.aes = list(colour = "grey35"),
                             order = 2),
         colour = guide_legend(title = "Mantel's p",
                               override.aes = list(size = 3),
                               order = 1),
         fill = guide_colorbar(title = "Pearson's r", order = 3))
D0
ggsave("Mental相关性网络图.jpg",width = 6, height = 6)
6 网络相关性图

此教程来自Lingc TONG的推文,原文教程链接基于netET和ggraph展示微生物与环境因子网络相关性。
6.1 数据准备
这里依旧使用前面的数据即可。
devtools::install_github("Hy4m/netET", force = TRUE)
#加载包
library(ggraph)
library(tidygraph)
library(netET)
library(vegan)
data("varespec")
data("varechem")
6.2 计算相关性,并提取绘图信息
p1 <- correlate(varechem, varespec, method = "spearman") |>
  as_tbl_graph(abs(r) > 0.5, p < 0.05)

# 计算节点的度中心性
degree_centrality <- degree(p1)

# 计算节点的度中心性
degree_centrality <- degree(p1, mode = "all")

# 将中心性值添加到 p1 中
p1$Degree <- degree_centrality

p1 <- p1 |>
  mutate(Degree = degree_centrality)
注意:刚开始,使用原文的代码提取信息,一直报错。后面,提示igraph包的版本过高,需要使用> 0.2版本包。在这里折腾了一会。最后依旧是降此包的版本。
步骤:
- 删除已有的
igraph包 - 重新安装
igraph包,并限制版本
install.packages("igraph",version = '0.1.7')
使用原文代码:
### 简洁代码
p1 <- correlate(varechem, varespec, method = "spearman") |>
  as_tbl_graph(abs(r) > 0.5, p < 0.05) |>
  mutate(Degree = centrality_degree())
> p1
# A tbl_graph: 58 nodes and 30 edges
#
# An undirected simple graph with 36 components
#
# A tibble: 58 × 2
  name  Degree

1 N          2
2 P          1
3 K          1
4 Ca         2
5 Mg         2
6 S          0
# ℹ 52 more rows
# ℹ Use `print(n = ...)` to see more rows
#
# A tibble: 30 × 4
   from    to      r       p

1    13    18  0.608 0.00163
2     1    20 -0.606 0.00168
3     7    26 -0.500 0.0128
# ℹ 27 more rows
# ℹ Use `print(n = ...)` to see more rows
xy <- layout_on_circle(p1)
head(xy)
> head(xy)
          [,1]      [,2]
[1,] 1.0000000 0.0000000
[2,] 0.9941380 0.1081190
[3,] 0.9766206 0.2149704
[4,] 0.9476532 0.3193015
[5,] 0.9075754 0.4198891
[6,] 0.8568572 0.5155539
6.3 绘制环形相关性图
D1 <- ggraph(p1, xy) +
  #geom_edge_fan(aes(colour = r > 0), width = 0.75, linetype="dashed") + #width 改变线条粗细
  geom_edge_fan(aes(colour = r > 0), width = 0.8) +
  geom_node_point(aes(size = Degree), colour = "#fa8c35") +
  scale_edge_colour_manual(values = c("TRUE" = "#c93756", "FALSE" = "#21a675"),#R>0,为TRUE
                           labels = c("Negative", "Positive")) +
  geom_node_text(aes(x = 1.07 * x,
                     y = 1.07 * y,
                     label = name,
                     angle = node_angle(x, y)),
                 hjust = "outward",
                 data = function(data) dplyr::filter(data, Degree > 0)) +
  expand_limits(x = c(-1.5, 1.5), y = c(-1.5, 1.5)) + #
  coord_fixed(clip = "off") +
  theme(panel.background = element_blank()) +
  labs(edge_colour = "Spearman's r")

ggsave("环形网络图.jpg", width = 6, height = 6)
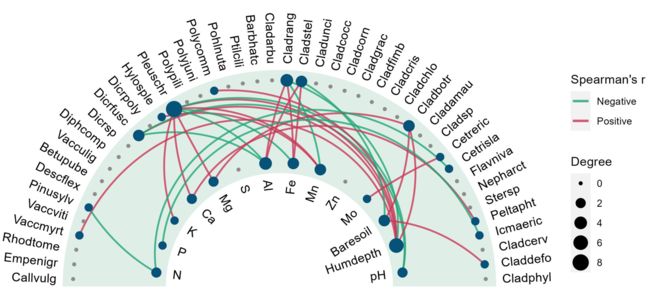
6.4 二分网络图
p2 <- correlate(varechem, varespec, method = "spearman") |>
  as_tbl_graph(abs(r) > 0.5, p < 0.05) |>
  mutate(Degree = centrality_degree()) |>
  as_bipartite_circular(outer_nodes = names(varespec))
p2
绘图
D2 <- ggraph(p2, layout_bipartite_circular(p2)) +
  annotate_arc_rect(0, 180,
                    fill = "#e0eee8",
                    r0 = 0.55,
                    r1 = 1.05) +
  geom_edge_circular(aes(colour = r > 0), edge_width = 0.75, edge_alpha = 0.8) +
  geom_node_point(aes(size = Degree, colour = Degree == 0)) +
  geom_node_text_circular(expand = 0.08) +
  scale_colour_manual(values = c("TRUE" = "grey55","FALSE" = "#065279"),
                      guide = "none") +
  scale_edge_colour_manual(values = c("TRUE" = "#c93756", "FALSE" = "#21a675"),
                           labels = c("Negative", "Positive")) +
  coord_fixed(clip = "off", xlim = c(-1.2, 1.2), ylim = c(0, 1.1)) +
  theme(panel.background = element_blank()) +
  guides(edge_colour = guide_legend(override.aes = list(edge_width = 1))) +
  labs(edge_colour = "Spearman's r")
D2
ggsave("二分网络图.jpg", width = 8, height = 8)
7 合并图形
library(patchwork)
library(cowplot)

D0+D1+D2+plot_layout(nrow = 1, ncol = 3, widths = c(6,5,6))
ggsave("20231012.jpg", width = 20, height = 10)
往期文章:
1. 复现SCI文章系列专栏
2. 《生信知识库订阅须知》,同步更新,易于搜索与管理。
3. 最全WGCNA教程(替换数据即可出全部结果与图形)
-
WGCNA分析 | 全流程分析代码 | 代码一
-
WGCNA分析 | 全流程分析代码 | 代码二
-
WGCNA分析 | 全流程代码分享 | 代码三
4. 精美图形绘制教程
- 精美图形绘制教程
5. 转录组分析教程
转录组上游分析教程[零基础]
小杜的生信筆記,主要发表或收录生物信息学的教程,以及基于R的分析和可视化(包括数据分析,图形绘制等);分享感兴趣的文献和学习资料!!
