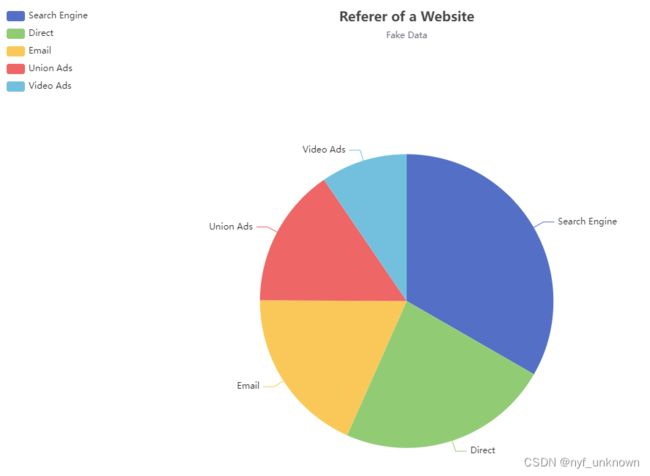
(echarts)饼图封装相关总结及使用
(echarts)饼图封装相关总结
一、封装组件pieCharts.vue
<template>
  <div :id="id" :class="className" :style="{ height: height, width: width }" />
</template>

<script>
import echarts from 'echarts'
import resize from '@/components/Charts/mixins/resize' //自适应画布

export default {
  mixins: [resize],
  props: {// 使用页面传的数据(有则用新,无则默认)
    className: {
      type: String,
      default: 'chart'
    },
    id: {
      type: String,
      default: 'chart'
    },
    width: {
      type: String,
      default: '100%'
    },
    height: {
      type: String,
      default: '400px'
    },
    xData: {
      type: Array,
      default: function() {
        return []
      }
    },
    chartData: {
      type: Object,
      default: function() {
        return {
          name: '偏好占比',
          datas: [
            { name: '爱好1', value: 63.8 },
            { name: '爱好2', value: 26.4 },
            { name: '其他', value: 9.8 }
          ]
        }
      }
      // required: true,
    }
  },
  data() {
    return {
      chart: null
    }
  },
  //监听数据若变化同步渲染图表
  watch: {
    chartData: {
      deep: true,
      handler(val) {
        this.setOptions(val)
      }
    }
  },
  // mounted周期
  mounted() {
    this.$nextTick(() => {
      this.initChart1()
    })
  },
  // beforeDestroy周期
  beforeDestroy() {
  	//如果chart存在则用dispose销毁,不存在则过
    if (!this.chart) {
      return
    }
    this.chart.dispose()
    this.chart = null
  },
  // 方法
  methods: {
    initChart1() {
      this.chart = echarts.init(document.getElementById(this.id), 'macarons')
      this.setOptions(this.chartData)
    },
    setOptions(chartObj) {
      this.chart.setOption({
        //标签设置
        tooltip: {
          trigger: 'item'
          formatter:'{b}:({d}%)',
        },
        //图例设置
        legend: {
          orient: 'horizontal',//水平
          left: 'center',  //居中
          orient: "vertical",//垂直
          left: "left",//左侧
          bottom: "5%",//距底部
          textStyle: {
            color: "#ffffff",
            size: 14,
          },
          type: "scroll",
          pageIconColor: '#ffffff', //图例分页左右箭头图标颜色
          pageTextStyle: {
            color: '#ffffff', //图例分页页码的颜色设置
          },
          pageIconSize: 12, //当然就是按钮的大小
          pageIconInactiveColor: "#7f7f7f", // 禁用的按钮颜色
        },
        //颜色设置
        color: [
          '#52A8FF',
          '#00B389',
          '#FFA940',
          '#FF5A57',
          '#29EFC4',
          '#F8AEA4',
          '#FFC53D',
          '#009982',
          '#C099FC',
          '#F5855F'
        ],
        //数据
        series: [
          {
            name: chartObj.name,//父组件传的数据名称
            type: 'pie',//类型
            radius: '50%',//半径程度,50%时是圆
            label: {
              normal: {
                formatter: "{b}:({d}%)",//显示格式
                formatter: (params) => {//显示格式
                  //调用自定义显示格式
                  return this.getEqualNewlineString(params,8); //过长处理
                },
              }
            },
            data: chartObj.datas,//父组件传的数据值
            emphasis: {
              itemStyle: {
                shadowBlur: 10,
                shadowOffsetX: 0,
                shadowColor: 'rgba(0, 0, 0, 0.5)'
              }
            }
          }
        ]
      })
    },
    //params 要处理的字符串 每行显示长度
    getEqualNewlineString(params, length) {
      return params.name +":" + "\n" +"("+params.percent+"%)"
      let text = "";
      let textString = `${params.name}:(${params.percent}%)`
      console.log(params);
      let count = Math.ceil(textString.length / length); // 向上取整数
      // 一行展示length个
      if (count > 1) {
        for (let z = 1; z <= count; z++) {
          text += textString.substr((z - 1) * length, length);
          if (z < count) {
            text += "\n";
          }
        }
      } else {
        text += textString.substr(0, length);
      }
      return text;
    },
  }
}
</script>

<style>
</style>
二、页面使用
<div class="charts">
 <pie-chart :id="'pieChart'" :height="'420px'" :chart-data="regionalDistribution" />
</div>

<script>
import PieChart from './charts/pieChart'
export default {
	components: { PieChart},//组件注册
	data(){
		return:{
	      regionalDistribution: {
	        name: '区域分布',
	        datas: []
	      },
		}
	}
}
</script>

// 样式
.charts {
    height: 420px;
    box-sizing: border-box;
    border: 1px solid rgb(213, 223, 232);
  }
拓展:自适应resize.js
import { debounce } from '@/utils'

export default {
  data() {
    return {
      $_sidebarElm: null,
      $_resizeHandler: null
    }
  },
  mounted() {
    this.initListener()
  },
  activated() {
    if (!this.$_resizeHandler) {
      // avoid duplication init
      this.initListener()
    }

    // when keep-alive chart activated, auto resize
    this.resize()
  },
  beforeDestroy() {
    this.destroyListener()
  },
  deactivated() {
    this.destroyListener()
  },
  methods: {
    // use $_ for mixins properties
    // https://vuejs.org/v2/style-guide/index.html#Private-property-names-essential
    $_sidebarResizeHandler(e) {
      if (e.propertyName === 'width') {
        this.$_resizeHandler()
      }
    },
    initListener() {
      this.$_resizeHandler = debounce(() => {
        this.resize()
      }, 100)
      window.addEventListener('resize', this.$_resizeHandler)

      this.$_sidebarElm = document.getElementsByClassName('sidebar-container')[0]
      this.$_sidebarElm && this.$_sidebarElm.addEventListener('transitionend', this.$_sidebarResizeHandler)
    },
    destroyListener() {
      window.removeEventListener('resize', this.$_resizeHandler)
      this.$_resizeHandler = null

      this.$_sidebarElm && this.$_sidebarElm.removeEventListener('transitionend', this.$_sidebarResizeHandler)
    },
    resize() {
      const { chart } = this
      chart && chart.resize()
    }
  }
}
