变分自动编码器 (VAE)02/2 PyTorch 教程
在自动编码器中,来自输入数据的信息被映射到固定的潜在表示中。当我们旨在训练模型以生成确定性预测时,这特别有用。相比之下,变分自动编码器(VAE)将输入数据转换为变分表示向量(顾名思义),其中该向量的元素表示有关输入数据分布的不同属性。VAE的这种概率特性使其成为一个生成模型。VAE中的潜在表示由最能定义输入数据的概率分布(μ,σ)组成。
二、前提知识
要了解有关VAE直觉的更多信息,我建议您阅读了解变分自动编码器(VAE)和什么是变分自动编码器?
三、VAE的PyTorch实现
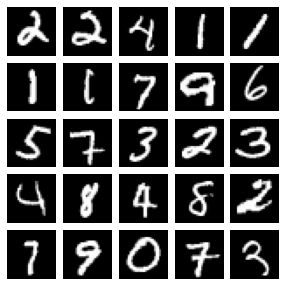
在本文中,我们只关注 PyTorch 中的简单 VAE,并在 MNIST 数据集上训练后可视化其潜在表示。让我们从导入一些库开始:
import torch
import numpy as np
import torch.nn as nn
import matplotlib.pyplot as plt
from torchvision.datasets import MNIST
from torch.utils.data import DataLoader
import torchvision.transforms as transforms
from mpl_toolkits.axes_grid1 import ImageGrid
from torchvision.utils import save_image, make_grid
并下载 MNIST 数据集并制作数据加载器:
# create a transofrm to apply to each datapoint
transform = transforms.Compose([transforms.ToTensor()])

# download the MNIST datasets
path = '~/datasets'
train_dataset = MNIST(path, transform=transform, download=True)
test_dataset  = MNIST(path, transform=transform, download=True)

# create train and test dataloaders
batch_size = 100
train_loader = DataLoader(dataset=train_dataset, batch_size=batch_size, shuffle=True)
test_loader = DataLoader(dataset=test_dataset, batch_size=batch_size, shuffle=False)

device = torch.device("cuda" if torch.cuda.is_available() else "cpu")
让我们可视化一些示例训练数据:
# get 25 sample training images for visualization
dataiter = iter(train_loader)
image = dataiter.next()

num_samples = 25
sample_images = [image[0][i,0] for i in range(num_samples)]

fig = plt.figure(figsize=(5, 5))
grid = ImageGrid(fig, 111, nrows_ncols=(5, 5), axes_pad=0.1)

for ax, im in zip(grid, sample_images):
    ax.imshow(im, cmap='gray')
    ax.axis('off')

plt.show()现在,我们创建一个简单的VAE,它具有完全连接的编码器和解码器。输入维度为 784,这是 MNIST 图像 (28×28) 的扁平维度。在编码器中,均值 (μ) 和方差 (σ²) 向量是我们的变分表示向量 (size=200)。请注意,我们将潜在方差与 epsilon (ε) 参数相乘,以便在解码之前重新参数化。这使我们能够执行反向传播并解决节点随机性。在此处阅读有关重新参数化的更多信息。
此外,我们的最终编码器维度为 2,即μ和σ向量。这些连续向量定义了我们的潜在空间分布,使我们能够在VAE中对图像进行采样。
class VAE(nn.Module):

    def __init__(self, input_dim=784, hidden_dim=400, latent_dim=200, device=device):
        super(VAE, self).__init__()

        # encoder
        self.encoder = nn.Sequential(
            nn.Linear(input_dim, hidden_dim),
            nn.LeakyReLU(0.2),
            nn.Linear(hidden_dim, latent_dim),
            nn.LeakyReLU(0.2)
            )

        # latent mean and variance
        self.mean_layer = nn.Linear(latent_dim, 2)
        self.logvar_layer = nn.Linear(latent_dim, 2)

        # decoder
        self.decoder = nn.Sequential(
            nn.Linear(2, latent_dim),
            nn.LeakyReLU(0.2),
            nn.Linear(latent_dim, hidden_dim),
            nn.LeakyReLU(0.2),
            nn.Linear(hidden_dim, input_dim),
            nn.Sigmoid()
            )

    def encode(self, x):
        x = self.encoder(x)
        mean, logvar = self.mean_layer(x), self.logvar_layer(x)
        return mean, logvar

    def reparameterization(self, mean, var):
        epsilon = torch.randn_like(var).to(device)
        z = mean + var*epsilon
        return z

    def decode(self, x):
        return self.decoder(x)

    def forward(self, x):
        mean, logvar = self.encode(x)
        z = self.reparameterization(mean, logvar)
        x_hat = self.decode(z)
        return x_hat, mean, log_var

    def forward(self, x):
        mean, log_var = self.encode(x)
        z = self.reparameterization(mean, torch.exp(0.5 * log_var))
        x_hat = self.decode(z)
        return x_hat, mean, log_var
现在,我们可以定义我们的模型和优化器:
model = VAE().to(device)
optimizer = Adam(model.parameters(), lr=1e-3)
VAE中的损失函数由再现损失和库尔巴克-莱布勒(KL)散度组成。KL 散度是用于衡量两个概率分布之间距离的指标。KL 散度是生成建模中的一个重要概念,但在本教程中,我们不会更详细地介绍。阅读更多:了解KL背离的直观指南。
def loss_function(x, x_hat, mean, log_var):
    reproduction_loss = nn.functional.binary_cross_entropy(x_hat, x, reduction='sum')
    KLD = - 0.5 * torch.sum(1+ log_var - mean.pow(2) - log_var.exp())

    return reproduction_loss + KLD
最后,我们可以训练我们的模型:
def train(model, optimizer, epochs, device):
    model.train()
    for epoch in range(epochs):
        overall_loss = 0
        for batch_idx, (x, _) in enumerate(train_loader):
            x = x.view(batch_size, x_dim).to(device)

            optimizer.zero_grad()

            x_hat, mean, log_var = model(x)
            loss = loss_function(x, x_hat, mean, log_var)

            overall_loss += loss.item()

            loss.backward()
            optimizer.step()

        print("\tEpoch", epoch + 1, "\tAverage Loss: ", overall_loss/(batch_idx*batch_size))
    return overall_loss

train(model, optimizer, epochs=50, device=device)
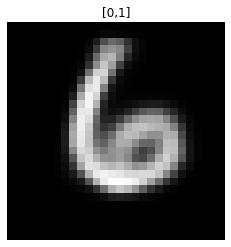
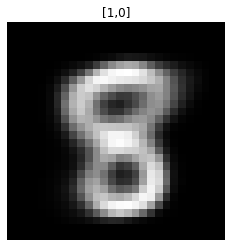
我们现在知道,从潜在空间生成图像所需要的只是两个浮点值(平均值和方差)。让我们从潜在空间生成一些图像:
def generate_digit(mean, var):
    z_sample = torch.tensor([[mean, var]], dtype=torch.float).to(device)
    x_decoded = model.decode(z_sample)
    digit = x_decoded.detach().cpu().reshape(28, 28) # reshape vector to 2d array
    plt.imshow(digit, cmap='gray')
    plt.axis('off')
    plt.show()

generate_digit(0.0, 1.0), generate_digit(1.0, 0.0)
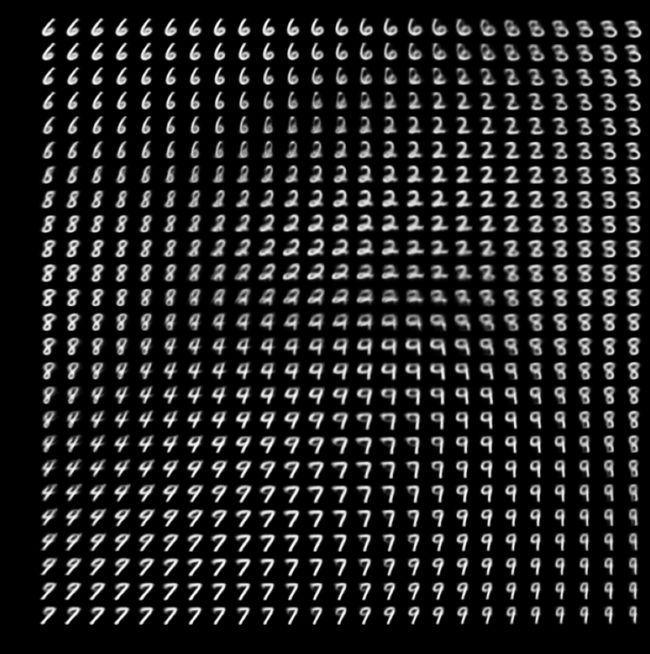
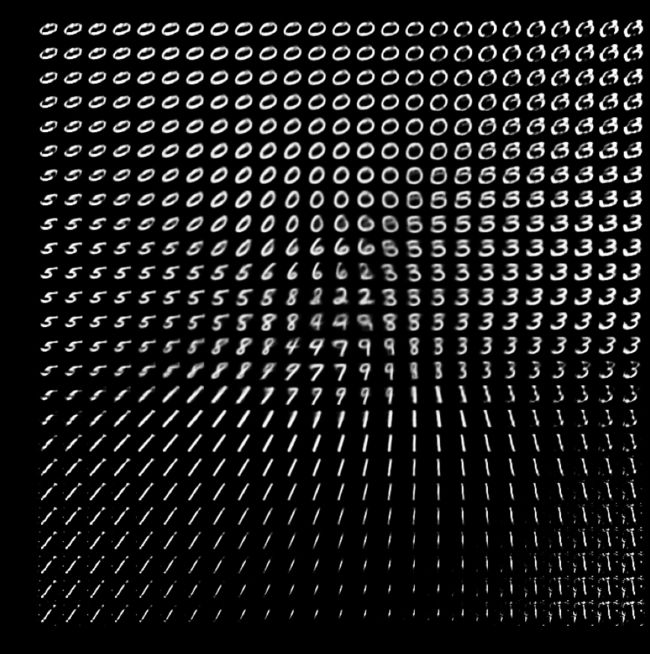
有趣!更令人印象深刻的潜在空间视图:
def plot_latent_space(model, scale=1.0, n=25, digit_size=28, figsize=15):
    # display a n*n 2D manifold of digits
    figure = np.zeros((digit_size * n, digit_size * n))

    # construct a grid
    grid_x = np.linspace(-scale, scale, n)
    grid_y = np.linspace(-scale, scale, n)[::-1]

    for i, yi in enumerate(grid_y):
        for j, xi in enumerate(grid_x):
            z_sample = torch.tensor([[xi, yi]], dtype=torch.float).to(device)
            x_decoded = model.decode(z_sample)
            digit = x_decoded[0].detach().cpu().reshape(digit_size, digit_size)
            figure[i * digit_size : (i + 1) * digit_size, j * digit_size : (j + 1) * digit_size,] = digit

    plt.figure(figsize=(figsize, figsize))
    plt.title('VAE Latent Space Visualization')
    start_range = digit_size // 2
    end_range = n * digit_size + start_range
    pixel_range = np.arange(start_range, end_range, digit_size)
    sample_range_x = np.round(grid_x, 1)
    sample_range_y = np.round(grid_y, 1)
    plt.xticks(pixel_range, sample_range_x)
    plt.yticks(pixel_range, sample_range_y)
    plt.xlabel("mean, z [0]")
    plt.ylabel("var, z [1]")
    plt.imshow(figure, cmap="Greys_r")
    plt.show()


plot_latent_space(model)
潜在空间可视化,范围:[-1.0、1.0]
这就是介于 -1.0 和 1.0 之间的均值和方差值的潜在空间的外观。如果我们将此比例更改为 -5.0 和 5.0 会发生什么?
潜在空间可视化,范围:[-5.0、5.0]
再次,有趣!现在,我们可以看到大多数数字表示形式所在的均值和方差值的范围。现在,我们知道如何从头开始构建一个简单的VAE,对图像进行采样并可视化潜在空间。但VAE并不止于此,还有更先进的技术使表征学习更加迷人。我将在以后的文章中探讨它们。在Github,LinkedIn和 Google Scholar上找到我。
四、在Google Colab中尝试代码:
import torch
import numpy as np
import torch.nn as nn
from torch.optim import Adam
import matplotlib.pyplot as plt
from torchvision.datasets import MNIST
from torch.utils.data import DataLoader
import torchvision.transforms as transforms
from mpl_toolkits.axes_grid1 import ImageGrid
from torchvision.utils import save_image, make_grid

# create a transofrm to apply to each datapoint
transform = transforms.Compose([transforms.ToTensor()])

# download the MNIST datasets
path = '~/datasets'
train_dataset = MNIST(path, transform=transform, download=True)
test_dataset  = MNIST(path, transform=transform, download=True)

# create train and test dataloaders
batch_size = 100
train_loader = DataLoader(dataset=train_dataset, batch_size=batch_size, shuffle=True)
test_loader = DataLoader(dataset=test_dataset, batch_size=batch_size, shuffle=False)

device = torch.device("cuda" if torch.cuda.is_available() else "cpu")

# get 25 sample training images for visualization
dataiter = iter(train_loader)
image = dataiter.next()

num_samples = 25
sample_images = [image[0][i,0] for i in range(num_samples)]

fig = plt.figure(figsize=(5, 5))
grid = ImageGrid(fig, 111, nrows_ncols=(5, 5), axes_pad=0.1)

for ax, im in zip(grid, sample_images):
    ax.imshow(im, cmap='gray')
    ax.axis('off')

plt.show()
class Encoder(nn.Module):

    def __init__(self, input_dim=784, hidden_dim=512, latent_dim=256):
        super(Encoder, self).__init__()

        self.linear1 = nn.Linear(input_dim, hidden_dim)
        self.linear2 = nn.Linear(hidden_dim, hidden_dim)
        self.mean = nn.Linear(hidden_dim, latent_dim)
        self.var = nn.Linear (hidden_dim, latent_dim)
        self.LeakyReLU = nn.LeakyReLU(0.2)
        self.training = True

    def forward(self, x):
        x = self.LeakyReLU(self.linear1(x))
        x = self.LeakyReLU(self.linear2(x))

        mean = self.mean(x)
        log_var = self.var(x)
        return mean, log_var

class Decoder(nn.Module):

    def __init__(self, output_dim=784, hidden_dim=512, latent_dim=256):
        super(Decoder, self).__init__()

        self.linear2 = nn.Linear(latent_dim, hidden_dim)
        self.linear1 = nn.Linear(hidden_dim, hidden_dim)
        self.output = nn.Linear(hidden_dim, output_dim)
        self.LeakyReLU = nn.LeakyReLU(0.2)

    def forward(self, x):
        x = self.LeakyReLU(self.linear2(x))
        x = self.LeakyReLU(self.linear1(x))

        x_hat = torch.sigmoid(self.output(x))
        return x_hat
class VAE(nn.Module):
def __init__(self, input_dim=784, hidden_dim=400, latent_dim=200, device=device):
super(VAE, self).__init__()
# encoder
self.encoder = nn.Sequential(
nn.Linear(input_dim, hidden_dim),
nn.LeakyReLU(0.2),
nn.Linear(hidden_dim, latent_dim),
nn.LeakyReLU(0.2)
)
# latent mean and variance
self.mean_layer = nn.Linear(latent_dim, 2)
self.logvar_layer = nn.Linear(latent_dim, 2)
# decoder
self.decoder = nn.Sequential(
nn.Linear(2, latent_dim),
nn.LeakyReLU(0.2),
nn.Linear(latent_dim, hidden_dim),
nn.LeakyReLU(0.2),
nn.Linear(hidden_dim, input_dim),
nn.Sigmoid()
)
def encode(self, x):
x = self.encoder(x)
mean, logvar = self.mean_layer(x), self.logvar_layer(x)
return mean, logvar
def reparameterization(self, mean, var):
epsilon = torch.randn_like(var).to(device)
z = mean + var*epsilon
return z
def decode(self, x):
return self.decoder(x)
def forward(self, x):
mean, logvar = self.encode(x)
z = self.reparameterization(mean, logvar)
x_hat = self.decode(z)
return x_hat, mean, log_var
def forward(self, x):
mean, log_var = self.encode(x)
z = self.reparameterization(mean, torch.exp(0.5 * log_var))
x_hat = self.decode(z)
return x_hat, mean, log_varmodel = VAE().to(device)
optimizer = Adam(model.parameters(), lr=1e-3)def loss_function(x, x_hat, mean, log_var):
reproduction_loss = nn.functional.binary_cross_entropy(x_hat, x, reduction='sum')
KLD = - 0.5 * torch.sum(1+ log_var - mean.pow(2) - log_var.exp())
return reproduction_loss + KLD
def train(model, optimizer, epochs, device, x_dim=784):
model.train()
for epoch in range(epochs):
overall_loss = 0
for batch_idx, (x, _) in enumerate(train_loader):
x = x.view(batch_size, x_dim).to(device)
optimizer.zero_grad()
x_hat, mean, log_var = model(x)
loss = loss_function(x, x_hat, mean, log_var)
overall_loss += loss.item()
loss.backward()
optimizer.step()
print("\tEpoch", epoch + 1, "\tAverage Loss: ", overall_loss/(batch_idx*batch_size))
return overall_loss
train(model, optimizer, epochs=50, device=device)Epoch 1 Average Loss: 180.83752029750104 Epoch 2 Average Loss: 163.2696611703099 Epoch 3 Average Loss: 158.45957443721306 Epoch 4 Average Loss: 155.22525566699707 Epoch 5 Average Loss: 153.2932642294449 Epoch 6 Average Loss: 151.85221148202734 Epoch 7 Average Loss: 150.7171567847454 Epoch 8 Average Loss: 149.69312638577316 Epoch 9 Average Loss: 148.78454667284015 Epoch 10 Average Loss: 148.15143693264815
def generate_digit(mean, var):
    z_sample = torch.tensor([[mean, var]], dtype=torch.float).to(device)
    x_decoded = model.decode(z_sample)
    digit = x_decoded.detach().cpu().reshape(28, 28) # reshape vector to 2d array
    plt.title(f'[{mean},{var}]')
    plt.imshow(digit, cmap='gray')
    plt.axis('off')
    plt.show()

#img1: mean0, var1 / img2: mean1, var0
generate_digit(0.0, 1.0), generate_digit(1.0, 0.0)
def plot_latent_space(model, scale=5.0, n=25, digit_size=28, figsize=15):
# display a n*n 2D manifold of digits
figure = np.zeros((digit_size * n, digit_size * n))
# construct a grid
grid_x = np.linspace(-scale, scale, n)
grid_y = np.linspace(-scale, scale, n)[::-1]
for i, yi in enumerate(grid_y):
for j, xi in enumerate(grid_x):
z_sample = torch.tensor([[xi, yi]], dtype=torch.float).to(device)
x_decoded = model.decode(z_sample)
digit = x_decoded[0].detach().cpu().reshape(digit_size, digit_size)
figure[i * digit_size : (i + 1) * digit_size, j * digit_size : (j + 1) * digit_size,] = digit
plt.figure(figsize=(figsize, figsize))
plt.title('VAE Latent Space Visualization')
start_range = digit_size // 2
end_range = n * digit_size + start_range
pixel_range = np.arange(start_range, end_range, digit_size)
sample_range_x = np.round(grid_x, 1)
sample_range_y = np.round(grid_y, 1)
plt.xticks(pixel_range, sample_range_x)
plt.yticks(pixel_range, sample_range_y)
plt.xlabel("mean, z [0]")
plt.ylabel("var, z [1]")
plt.imshow(figure, cmap="Greys_r")
plt.show()
plot_latent_space(model, scale=1.0)
plot_latent_space(model, scale=5.0)礼萨·卡兰塔尔

