数据分析实战——货币分析与预测
目录
一、比特币分析与预测
1.前置准备
2.比特币价格变化趋势分析
3.稳定性检测与时间序列检测
4.数据变化
5.模型分析
6.残留物分析
7.预测
二、参考资料
总结
梗概
本篇博客主要通过几个实例(不断更新,欢迎关注!)实践各种数据分析与机器学习处理方法(内附数据集与python代码)
一、货币分析与预测
1.前置准备
下载数据库(包含各时段价格、时间等因素),下载地址为Bitcoin Historical Data | Kaggle,本站笔者已上传资源,在主页内资源可找到分析数据集python-统计分析文档类资源-CSDN文库,导入相关包与数据如下:
import numpy as np
import pandas as pd
import seaborn as sns
import matplotlib.pyplot as plt
import matplotlib as mpl
from scipy import stats
import statsmodels.api as sm
import warnings
from itertools import product
from datetime import datetime
warnings.filterwarnings('ignore')
plt.style.use('seaborn-poster')
df = pd.read_csv('../input/workshop1/BTCUSD.csv')2.货币价格变化趋势分析
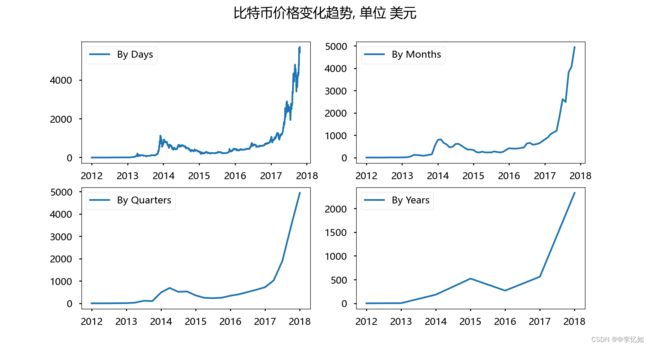
通过对数据库中四种因素来分别分析其对货币价格变化的影响并绘图,代码如下:
# 时间戳转化为日常时间格式
df.Timestamp = pd.to_datetime(df.Timestamp, unit='s')

# 对样本在不同时间频率上进行采样
df.index = df.Timestamp
df = df.resample('D').mean()

df_month = df.resample('M').mean()

df_year = df.resample('A-DEC').mean()

df_Q = df.resample('Q-DEC').mean()

# 中文乱码处理
plt.rcParams['font.sans-serif'] =['Microsoft YaHei']
plt.rcParams['axes.unicode_minus'] = False

# 绘图
fig = plt.figure(figsize=[15, 8])
plt.suptitle("比特币价格变化趋势, 单位 美元", fontsize=22)

plt.subplot(221)
plt.plot(df.Weighted_Price, '-', label='By Days')
plt.legend()

plt.subplot(222)
plt.plot(df_month.Weighted_Price, '-', label='By Months')
plt.legend()

plt.subplot(223)
plt.plot(df_Q.Weighted_Price, '-', label='By Quarters')
plt.legend()

plt.subplot(224)
plt.plot(df_year.Weighted_Price, '-', label='By Years')
plt.legend()

plt.show()
效果如图所示:
3.稳定性检测与时间序列检测
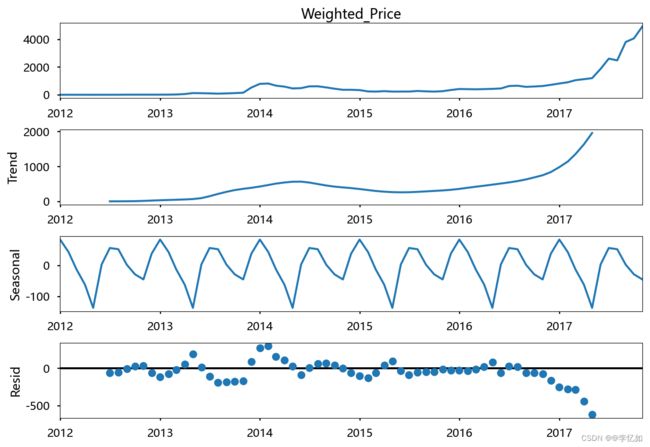
对上述四种影响货币价格走向的四种因素分别进行稳定性与时间序列检测,代码如下:
plt.figure (figsize=[15, 7])
sm.tsa.seasonal_decompose(df_month.Weighted_Price).plot()
print("Dickey–Fuller test: p=%f" % sm.tsa.stattools.adfuller(df_month.Weighted_Price)[1])
plt.show()
效果如图所示:
4.数据变化
由于连续的响应变量不满足正态分布,所以数据需要进行Box-Cox变换,代码如下:
df_month['Weighted_Price_box'], lmbda = stats.boxcox(df_month.Weighted_Price)
print("Dickey–Fuller test: p=%f" % sm.tsa.stattools.adfuller(df_month.Weighted_Price)[1])
由于时间序列季节对数据的影响,所以季节差异化需要考虑,代码如下:
df_month['prices_box_diff'] = df_month.Weighted_Price_box - df_month.Weighted_Price_box.shift(12)
print("Dickey–Fuller test: p=%f" % sm.tsa.stattools.adfuller(df_month.prices_box_diff[12:])[1])
为减少数据的随机性与波动性,需要进行数据规律化分布,代码如下:
# Regular differentiation
df_month['prices_box_diff2'] = df_month.prices_box_diff - df_month.prices_box_diff.shift(1)
plt.figure(figsize=(15,7))

# STL-decomposition
sm.tsa.seasonal_decompose(df_month.prices_box_diff2[13:]).plot()
print("Dickey–Fuller test: p=%f" % sm.tsa.stattools.adfuller(df_month.prices_box_diff2[13:])[1])

plt.show()
效果如图:
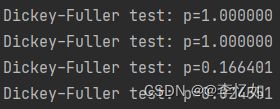
三种数据变化后的test效果如图12所示。
5.模型分析
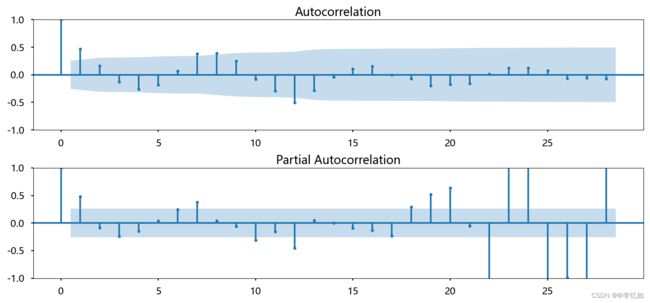
将处理完的数据导入对应的模型中,使用自相关和部分自相关图对参数进行初始近似处理代码如下:
# Initial approximation of parameters using Autocorrelation and Partial Autocorrelation Plots
plt.figure(figsize=(15, 7))
ax = plt.subplot(211)
sm.graphics.tsa.plot_acf(df_month.prices_box_diff2[13:].values.squeeze(), lags=28, ax=ax)
ax = plt.subplot(212)
sm.graphics.tsa.plot_pacf(df_month.prices_box_diff2[13:].values.squeeze(), lags=28, ax=ax)
plt.tight_layout()
plt.show()
效果如图:
参数初始化与模型选择代码如下:
# Initial approximation of parameters
Qs = range(0, 2)
qs = range(0, 3)
Ps = range(0, 3)
ps = range(0, 3)
D = 1
d = 1
parameters = product(ps, qs, Ps, Qs)
parameters_list = list(parameters)
len(parameters_list)

# Model Selection
results = []
best_aic = float("inf")
warnings.filterwarnings('ignore')
for param in parameters_list:
    try:
        model = sm.tsa.statespace.SARIMAX(df_month.Weighted_Price_box, order=(param[0], d, param[1]),
                                          seasonal_order=(param[2], D, param[3], 12)).fit(disp=-1)
    except ValueError:
        print('wrong parameters:', param)
        continue
    aic = model.aic
    if aic < best_aic:
        best_model = model
        best_aic = aic
        best_param = param
    results.append([param, model.aic])
result_table = pd.DataFrame(results)
result_table.columns = ['parameters', 'aic']
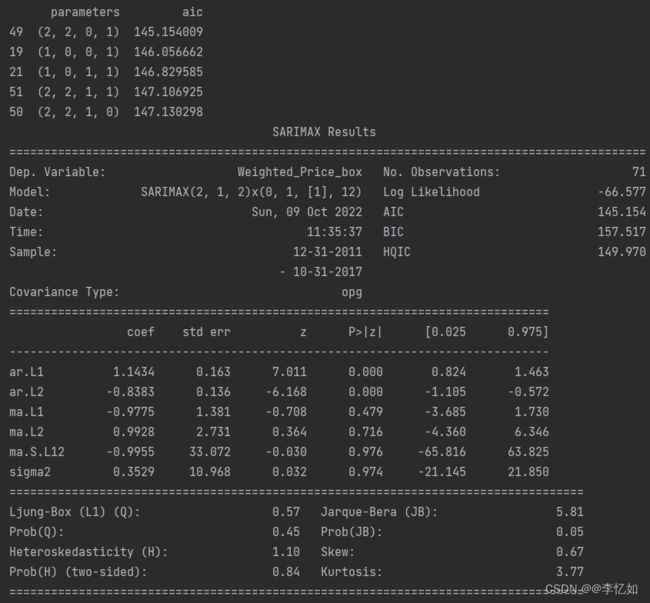
print(result_table.sort_values(by='aic', ascending=True).head())
print(best_model.summary())
参数与建模结果如所示:
6.残留物分析
使用STL分解法对残留物进行分析,代码如下:
# STL-decomposition
plt.figure(figsize=(15, 7))
plt.subplot(211)
best_model.resid[13:].plot()
plt.ylabel(u'Residuals')
ax = plt.subplot(212)
sm.graphics.tsa.plot_acf(best_model.resid[13:].values.squeeze(), lags=48, ax=ax)

print("Dickey–Fuller test:: p=%f" % sm.tsa.stattools.adfuller(best_model.resid[13:])[1])

plt.tight_layout()
plt.show()
效果如图所示:
7.预测
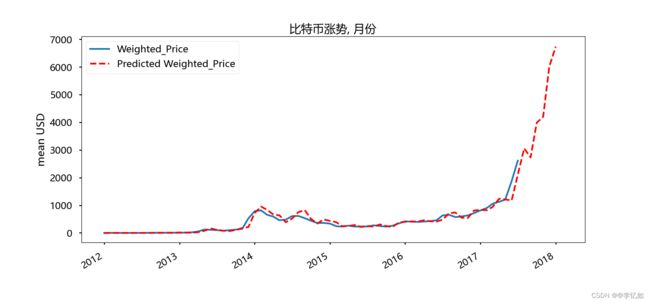
根据前六步得到的分析数据与模型结果,基于时间序列与四种因素对比特币价格进行预测,并与实际价格趋势曲线进行拟合对比,代码如下:
def invboxcox(y, lmbda):
    if lmbda == 0:
        return np.exp(y)
    else:
        return np.exp(np.log(lmbda * y + 1) / lmbda)


# 预测
df_month2 = df_month[['Weighted_Price']]
date_list = [datetime(2017, 6, 30), datetime(2017, 7, 31), datetime(2017, 8, 31), datetime(2017, 9, 30),
             datetime(2017, 10, 31), datetime(2017, 11, 30), datetime(2017, 12, 31), datetime(2018, 1, 31),
             datetime(2018, 1, 28)]
future = pd.DataFrame(index=date_list, columns=df_month.columns)
df_month2 = pd.concat([df_month2, future])
df_month2['forecast'] = invboxcox(best_model.predict(start=0, end=75), lmbda)
plt.figure(figsize=(15, 7))
df_month2.Weighted_Price.plot()
df_month2.forecast.plot(color='r', ls='--', label='Predicted Weighted_Price')
plt.legend()
plt.rcParams['font.sans-serif'] = ['Microsoft YaHei']
plt.rcParams['axes.unicode_minus'] = False
plt.title('比特币涨势, 月份')
plt.ylabel('mean USD')
plt.show()
效果如图所示:
分析:由图可见,实际曲线与预测曲线拟合较好,说明模型的优越性,预测算法的准确性,有着较好的预测效果。
二、参考资料
1.Bitcoin Historical Data | Kaggle
2.价格预测 - Heywhale.com
3.十个Kaggle项目带你入门数据分析 - 知乎 (zhihu.com)
总结
一文搞懂数据分析那点事儿!!!实践出真知,跑起来吧~
