CentOS7.8-搭建Prometheus+Grafana
目录
Prometheus+Grafana搭建
一、Prometheus介绍
特点
工作原理
Prometheus组件
Grafana介绍
七大特点
二、安装
2.1资源配置
2.2部署Prometheus服务器
2.3部署node_exporter(agent/Prometheus两个服务器)
2.4Grafana服务器
Prometheus+Grafana搭建
一、Prometheus介绍
Prometheus由Go语言编写而成,采用Pull方式获取监控信息,并提供了多维度的数据模型和灵活的查询接口。Prometheus不仅可以通过静态文件配置监控对象,还支持自动发现机制,能通过Kubernetes、Consl、DNS等多种方式动态获取监控对象。在数据采集方面,借助Go语言的高并发特性,单机Prometheus可以采取数百个节点的监控数据;在数据存储方面,随着本地时序数据库的不断优化,单机Prometheus每秒可以采集一千万个指标,如果需要存储大量的历史监控数据,则还支持远程存储。
特点
提供多维度数据模型和灵活的查询方式,通过将监控指标关联多个tag,来将监控数据进行任意维度的组合,并且提供简单的PromQL查询方式,还提供HTTP查询接口,可以很方便地结合Grafana等GUI组件展示数据
在不依赖外部存储的情况下,支持服务器节点的本地存储,通过Prometheus自带的时序数据库,可以完成每秒千万级的数据存储;不仅如此,在保存大量历史数据的场景中,Prometheus可以对接第三方时序数据库和OpenTSDB等。
定义了开放指标数据标准,以基于HTTP的Pull方式采集时序数据,只有实现了Prometheus监控数据才可以被Prometheus采集、汇总、并支持Push方式向中间网关推送时序列数据,能更加灵活地应对多种监控场景
支持通过静态文件配置和动态发现机制发现监控对象,自动完成数据采集。Prometheus目前已经支持Kubernetes、etcd、Consul等多种服务发现机制
易于维护,可以通过二进制文件直接启动,并且提供了容器化部署镜像。
支持数据的分区采样和联邦部署,支持大规模集群监控
工作原理
Prometheus Server负载定时在目标上抓取metrics(指标)数据,每个抓取目标都需要暴露一个HTTP服务接口用于Prometheus定时抓取。这种调用被监控对象获取监控数据的方式被称为Pull。Pull方式体现了Prometheus独特的设计哲学与大多数采用Push(推)方式的监控不同;
pull方式采集数据来源:
通过配置文件、文本等进行静态配置
支持Zookeeper、Consul、Kubernetes等方式进行动态发现,例如对Kuernetes的动态发现,Prometheus使用Kubernetes的API查询和监控容器信息的变化,动态更新监控对象,这样容器的创建和删除都可以被Prometheus感知
Storage通过一定的规则清理和整理数据,并把得到的结果从年初到新的时间序列中,这里存储的方式有两种:
1.本地存储。通过Prometheus自带的时序数据库将数据库数据保存在本地磁盘。但是本地存储的容量毕竟有限,建议不要保存超过一个月的数据
2.另一种是远程存储,适用于存储大量监控数据。通过中间层的适配器的转发,目前Prometheus支持OpenTsdb、InfluxDB、Elasticsearch等后端存储,通过适配器实现Prometheus存储的remote write和remote read接口,便可以接入Prometheus作为远程存储使用。Prometheus通过PromQL和其他API可视化地展示收集的数据。Prometheus支持多种方式的图标可视化,例如Grafana、自带的PromDash及自身提供的模板引擎等。Prometheus还提供HTTP API查询方法,自定义所需要的输出
Prometheus通过Pull方式拉取数据,但某些现有系统是通过Push方式实现的,为了接入这些系统,Prometheus提供了对PushGateway的支持,这些系统主动推送metrics到PushGateway,而Prometheus只是定时去Gateway上抓取数据
Prometheus组件
Prometheus由多个组件组成,但是其中许多组件是可选的;
 Prometheus Server 用于抓取指标、存储时间序列数据
 exporter 暴露指标让任务抓取
 Pushgateway push的方式将指标数据推送到网关
 alertmanager 处理报警的报警组件
 adhoc 用于数据查询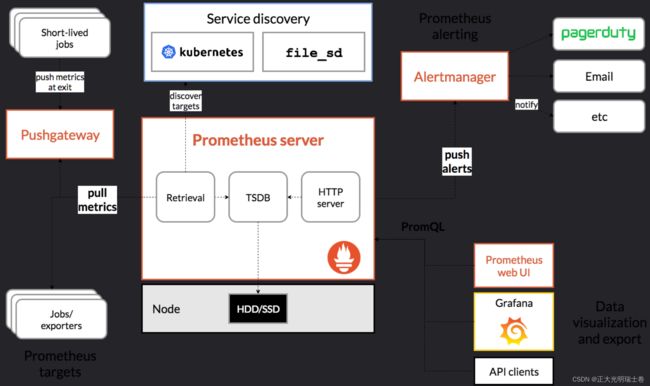
说明:
(1)Prometheus server:服务核心组件,采用 pull 方式收集 apiserver、scheduler、controller-manager、kubelet 组件数据, 通过 http 协议传输。并存储时间序列数据。
(2)Exporters/Jobs:负责收集不支持Instrumentation的目标对象(host, container…)的性能数据,并通过 HTTP 接口供 Prometheus Server 获取。
●Node-Exporter:用于收集k8s集群中各node节点的物理指标状态数据,如平均负载、CPU、内存、磁盘、网络等资源信息的指标数据,需要部署到所有运算节点。
●Kube-State-Metrics:为prometheus采集k8s资源数据的exporter,通过监听APIServer收集kubernetes集群内资源对象的状态指标数据,例如pod、deployment、service等等。同时它也提供自己的数据,主要是资源采集个数和采集发生的异常次数统计。 需要注意的是kube-state-metrics只是简单的提供一个metrics数据,并不会存储这些指标数据,所以可以使用Prometheus来抓取这些数据然后存储,主要关注的是业务相关的一些元数据,比如Deployment、Pod、副本状态等;调度了多少个replicas?现在可用的有几个?多少个Pod是running/stopped/terminated状态?Pod重启了多少次?有多少job在运行中。
●cadvisor:用来监控容器内部使用资源的信息,比如 CPU、内存、网络I/O、磁盘I/O。
●blackbox-exporter:监控业务容器存活性。
(3)Service Discovery:服务发现,Prometheus支持多种服务发现机制:文件,DNS,Consul,Kubernetes,OpenStack,EC2等等。 基于服务发现的过程并不复杂,通过第三方提供的接口,Prometheus查询到需要监控的Target列表,然后轮训这些Target获取监控数据。
(4)Alertmanager:是一个独立的告警模块,从 Prometheus server 端接收到 alerts 后,会进行去重、分组, 并路由到相应的接收方,发出报警,常见的接收方式有:电子邮件,微信,钉钉等。
(5)Pushgateway:类似一个中转站,Prometheus 的 server 端只会使用 pull 方式拉取数据,但是某些节点因为某些原因只能使用 push 方式推送数据,那么它就是用来接收 push 而来的数据并暴露给 Prometheus 的 server 拉取的中转站。 可以理解成目标主机可以上报短期任务的数据到 Pushgateway,然后 Prometheus server 统一从 Pushgateway 拉取数据。
(6)Grafana:是一个跨平台的开源的度量分析和可视化工具,可以将采集的数据可视化的展示,并及时通知给告警接收方。其官方库中具有丰富的仪表盘插件。
Grafana是一款用Go语言开发的开源数据可视化工具,可以做数据监控和数据统计,带有告警功能。目前使用grafana的公司有很多,如paypal、ebay、intel等。
Grafana介绍
Grafana是一款用Go语言开发的开源数据可视化工具,可以做数据监控和数据统计,带有告警功能。目前使用grafana的公司有很多,如paypal、ebay、intel等
七大特点
①可视化:快速和灵活的客户端图形具有多种选项。面板插件为许多不同的方式可视化指标和日志。
②报警:可视化地为最重要的指标定义警报规则。Grafana将持续评估它们,并发送通知。
③通知:警报更改状态时,它会发出通知。接收电子邮件通知。
④动态仪表盘:使用模板变量创建动态和可重用的仪表板,这些模板变量作为下拉菜单出现在仪表板顶部。
⑤混合数据源:在同一个图中混合不同的数据源!可以根据每个查询指定数据源。这甚至适用于自定义数据源。
⑥注释:注释来自不同数据源图表。将鼠标悬停在事件上可以显示完整的事件元数据和标记。
⑦过滤器:过滤器允许您动态创建新的键/值过滤器,这些过滤器将自动应用于使用该数据源的所有查询。
二、安装
2.1资源配置
| IP | 节点 | 组件 |
|---|---|---|
| 192.168.200.104 | Prometheus服务器 | Prometheus、Node_exporter |
| 192.168.200.105 | Agent服务器 | Node_exporter |
| 192.168.200.106 | Grafana服务器 | Grafana |
2.2部署Prometheus服务器
Prometheus官网:Download | Prometheus
#解压
[root@localhost software]# ls
node_exporter-1.5.0.linux-amd64.tar.gz prometheus-2.37.6.linux-amd64.tar.gz
[root@localhost software]# tar -xvf prometheus-2.37.6.linux-amd64.tar.gz -C /usr/local/
prometheus-2.37.6.linux-amd64/
prometheus-2.37.6.linux-amd64/console_libraries/
prometheus-2.37.6.linux-amd64/console_libraries/menu.lib
prometheus-2.37.6.linux-amd64/console_libraries/prom.lib
prometheus-2.37.6.linux-amd64/LICENSE
prometheus-2.37.6.linux-amd64/prometheus.yml
prometheus-2.37.6.linux-amd64/promtool
prometheus-2.37.6.linux-amd64/prometheus
prometheus-2.37.6.linux-amd64/NOTICE
prometheus-2.37.6.linux-amd64/consoles/
prometheus-2.37.6.linux-amd64/consoles/node-overview.html
prometheus-2.37.6.linux-amd64/consoles/node-cpu.html
prometheus-2.37.6.linux-amd64/consoles/node.html
prometheus-2.37.6.linux-amd64/consoles/prometheus-overview.html
prometheus-2.37.6.linux-amd64/consoles/prometheus.html
prometheus-2.37.6.linux-amd64/consoles/index.html.example
prometheus-2.37.6.linux-amd64/consoles/node-disk.html
mv /usr/local/prometheus-2.37.0.linux-amd64/ /usr/local/prometheus
#改个名儿
[root@localhost software]# mv /usr/local/prometheus-2.37.6.linux-amd64/ /usr/local/prometheus
#进入目录
[root@localhost software]# cd /usr/local/prometheus/
#查看版本信息
[root@localhost prometheus]# ./prometheus --version
prometheus, version 2.37.6 (branch: HEAD, revision: 8ade24a23af6be0f35414d6e8ce09598446c29a2)
build user: root@5f96027a7c3e
build date: 20230220-09:36:40
go version: go1.19.6
platform: linux/amd642.2.1Prometheus主配置文件
 #当前环境主配置文件可不用更改
 [root@localhost prometheus]# vim /usr/local/prometheus/prometheus.yml
2.2.2注册系统服务
[root@localhost prometheus]# vim /usr/lib/systemd/system/prometheus.service
[Unit]
Description=Prometheus Server
Documentation=https://prometheus.io
After=network.target
[Service]
Type=simple
ExecStart=/usr/local/prometheus/prometheus \
--config.file=/usr/local/prometheus/prometheus.yml \
--storage.tsdb.path=/usr/local/prometheus/data/ \
--storage.tsdb.retention=15d \
--web.enable-lifecycle
ExecReload=/bin/kill -HUP $MAINPID
Restart=on-failure
[Install]
WantedBy=multi-user.target
#启动服务
[root@localhost prometheus]# systemctl enable --now prometheus
Created symlink from /etc/systemd/system/multi-user.target.wants/prometheus.service to /usr/lib/systemd/system/prometheus.service.2.2.3访问主机ip+端口9090页面

点击进入stats,点击Targets

可以看到当前只监控了本机

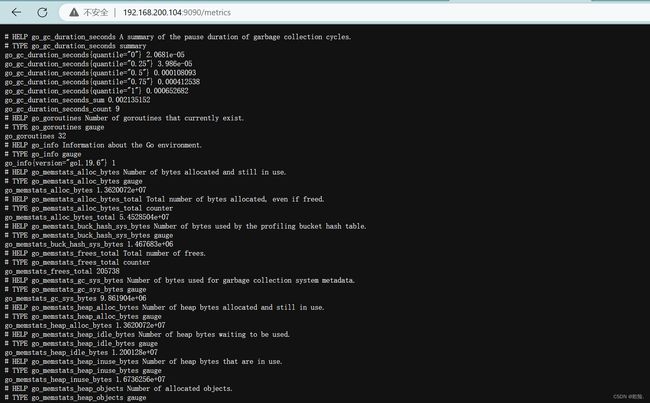
访问http:// 服务器 IP:9090/metrics 可以查看到监控的数据
2.3部署node_exporter(agent/Prometheus两个服务器)
Exporter是Prometheus的指标数据收集组件。它负责从目标Jobs收集数据,并把收集到的数据转换为Prometheus支持的时序数据格式。 和传统的指标数据收集组件不同的是,他只负责收集,并不向Server端发送数据,而是等待Prometheus Server 主动抓取,node-exporter 默认的抓取url地址:http://ip:9100/metrics
#解压
[root@localhost prometheus]# cd /root/software/
[root@localhost software]# ls
node_exporter-1.5.0.linux-amd64.tar.gz prometheus-2.37.6.linux-amd64.tar.gz
[root@localhost software]# tar -xvf node_exporter-1.5.0.linux-amd64.tar.gz -C /usr/local/bin/
node_exporter-1.5.0.linux-amd64/
node_exporter-1.5.0.linux-amd64/LICENSE
node_exporter-1.5.0.linux-amd64/NOTICE
node_exporter-1.5.0.linux-amd64/node_exporter
#改个名~
[root@localhost software]# mv /usr/local/bin/node_exporter-1.5.0.linux-amd64/ /usr/local/bin/node_exporter#启动node_exporter
 nohup /usr/local/bin/node_exporter/node_exporter &

 ss -natp | grep 9100
访问本地IP:9100/metrics,显示如下表示开启成功 (被监控端的收集到的监控数据)

2.3.1查看node_exporter已经启动成功
[root@localhost software]# vim /etc/systemd/system/node_exporter.service
[Unit]
Description=node_exporter Monitoring System
Documentation=node_exporter Monitoring System
[Service]
ExecStart=/usr/local/bin/node_exporter/node_exporter --web.listen-address=:9100
[Install]
WantedBy=multi-user.target
#启动前先杀死上一个进程,否则这里会报端口冲突的错误
[root@localhost software]# systemctl daemon-reload
[root@localhost software]# systemctl enable --now node_exporter.service
Created symlink from /etc/systemd/system/multi-user.target.wants/node_exporter.service to /etc/systemd/system/node_exporter.service.
[root@localhost software]# systemctl status node_exporter.service
● node_exporter.service - node_exporter Monitoring System
Loaded: loaded (/etc/systemd/system/node_exporter.service; enabled; vendor preset: disabled)
Active: active (running) since 四 2023-04-06 23:46:00 CST; 425ms ago
Main PID: 2219 (node_exporter)
Tasks: 4
Memory: 7.0M
CGroup: /system.slice/node_exporter.service
└─2219 /usr/local/bin/node_exporter/node_exporter --web.listen-address=:9100
[root@localhost software]# netstat -anpt | grep 9100
tcp6 0 0 :::9100 :::* LISTEN 1522/node_exporter 2.3.2Prometheus服务器添加被监控节点为target
Prometheus服务器(192.168.200.104)
进入Prometheus配置文件添加target
 [root@localhost software]# vim /usr/local/prometheus/prometheus.yml
 #进入Prometheus安装目录下修改主配置文件

 主要添加

 #省略部分内容

 scrape_configs:
 #添加在该字段下

   - job_name: 'server'
     static_configs:
       - targets: ['localhost:9100']


   - job_name: 'agent'
     static_configs:
       - targets: ['192.168.200.105:9100']
重启完Prometheus后对浏览器上的http://Prometheus服务器IP:9090进行刷新

监控目标agent和server添加成功
2.4Grafana服务器
Grafana官网:Download Grafana | Grafana Labs
wget https://dl.grafana.com/enterprise/release/grafana-enterprise-9.2.1-1.x86_64.rpm
sudo yum install grafana-enterprise-9.2.1-1.x86_64.rpm
#启动Grafana
systemctl daemon-reload
systemctl start grafana-server
systemctl status grafana-server
systemctl enable grafana-server
#用docker启动
[root@localhost docker-ce--1.23.1.rpm]# docker load -i /root/software/grafana-enterprise.tar
34d5ebaa5410: Loading layer 5.866MB/5.866MB
579bcda65f88: Loading layer 3.072kB/3.072kB
78559bd3bf46: Loading layer 5.055MB/5.055MB
0e1807ef425a: Loading layer 5.94MB/5.94MB
1d10dec99b22: Loading layer 9.553MB/9.553MB
2b2eefd3b8b8: Loading layer 350MB/350MB
fc17ce513b56: Loading layer 1.536kB/1.536kB
4c186a97ae6c: Loading layer 90.11kB/90.11kB
a5359d592bd8: Loading layer 5.12kB/5.12kB
Loaded image: grafana/grafana-enterprise:9.2.1
[root@localhost ~]# docker images
REPOSITORY TAG IMAGE ID CREATED SIZE
grafana/grafana-enterprise 9.2.1 a45674740e38 5 months ago 370MB
[root@localhost ~]# docker run -d --name grafana -p 3000:3000 grafana/grafana-enterprise:9.2.1
4d9ecc307b0229cf42119aa2ffcaf3e202fc92733646a9a73214dc99b3ca6e08
[root@localhost ~]# docker ps -a
CONTAINER ID IMAGE COMMAND CREATED STATUS PORTS NAMES
4d9ecc307b02 grafana/grafana-enterprise:9.2.1 "/run.sh" 8 seconds ago Up 8 seconds 0.0.0.0:3000->3000/tcp, :::3000->3000/tcp grafana2.4.1浏览器访问Grafana
浏览器访问http://Grafana服务器IP:3000进行访问,初始用户admin密码admin
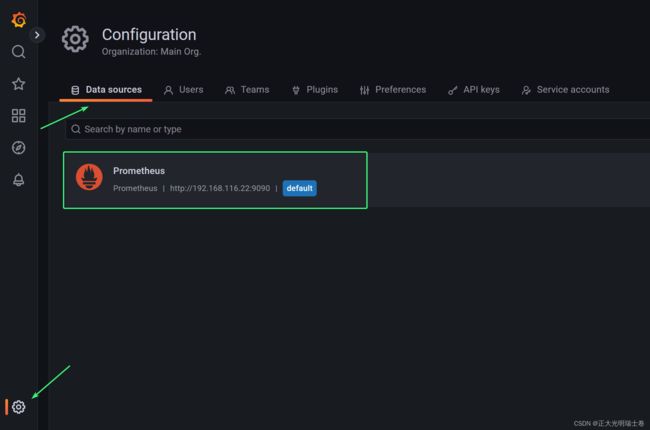
第一次登录进入后会让你设置新的密码,进入Grafana,点击DATA SOURCES添加数据源

选择Prometheus


添加成功的数据源查看

2.4.2定义数据源的数据展示
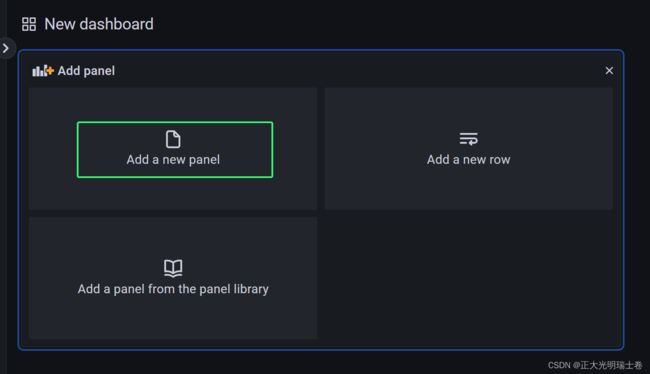
定义显示内容
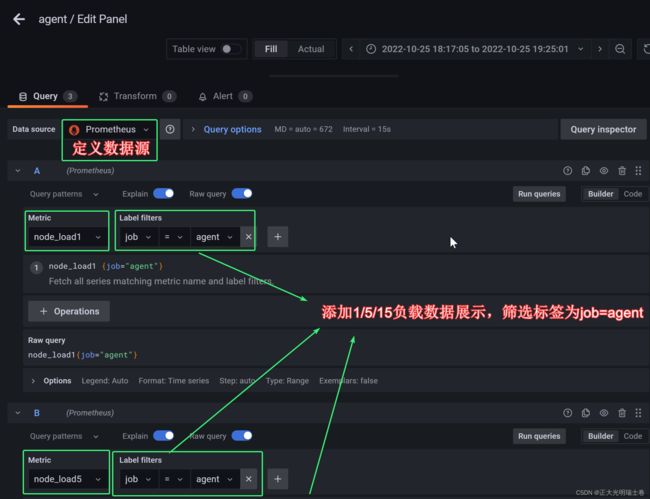
给个名儿:agent(192.168.200.105服务器平均负载信息)

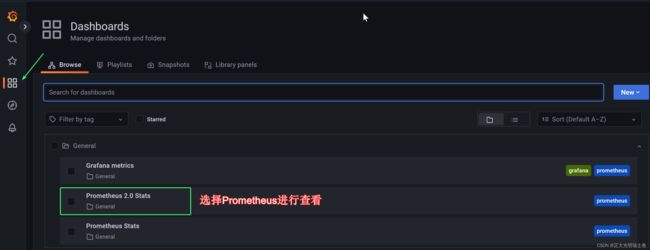
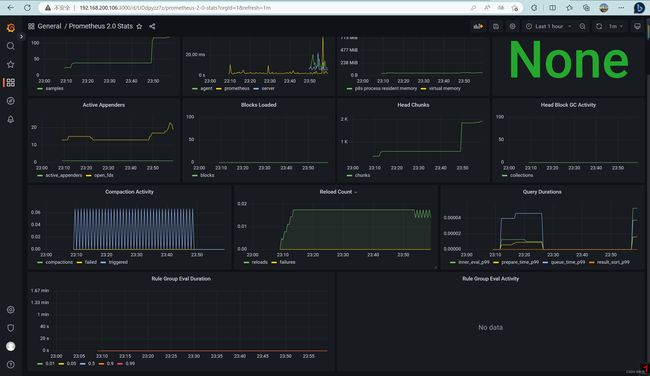
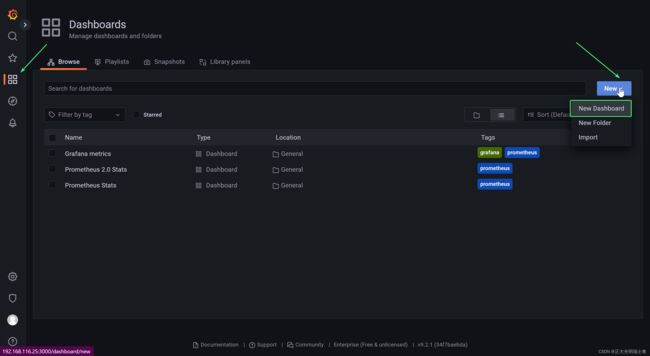
2.4.3Grafana模版
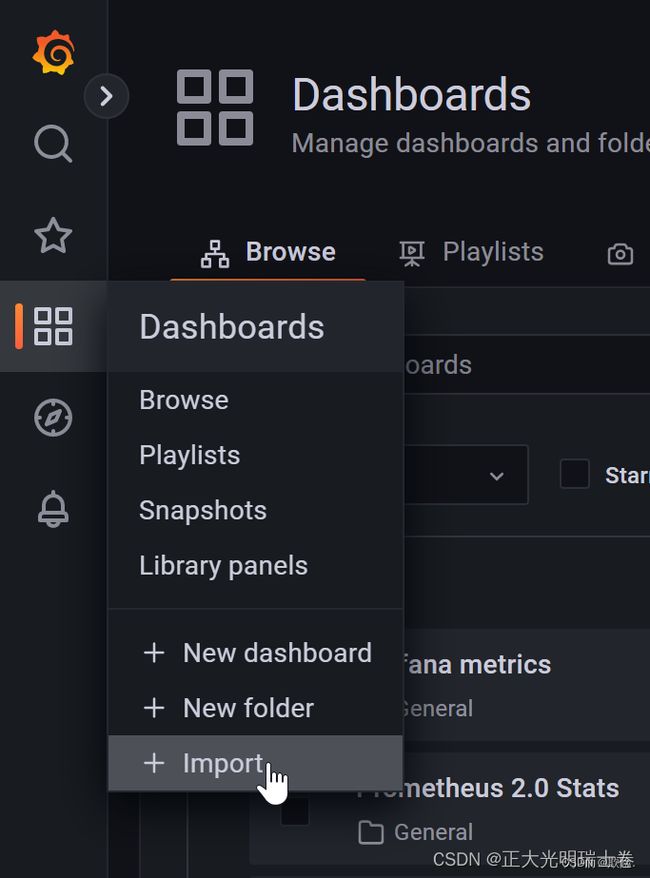
Grafana官方提供模板地址:Dashboards | Grafana Labs
可以点击这里import需要的模板,通过复制 ID
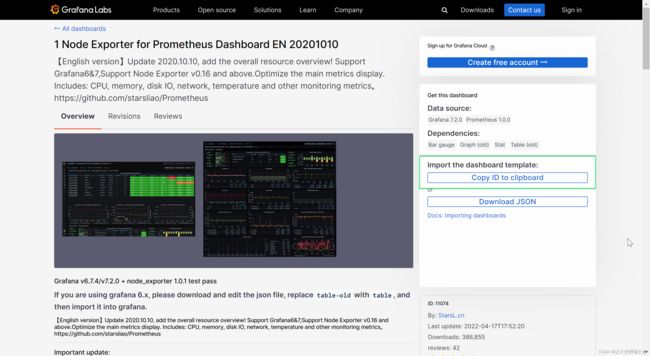
通过复制的ID来部署使用模板到指定的数据源