Matplotlib学习
Matplotlib学习
官网:pyplot — Matplotlib 2.0.2 documentation
· 散点图(Scatter)
可参考:(3条消息) plt.scatter()_coder-CSDN博客_plt.scatter
matplotlib.pyplot.scatter(x, y, s=None, c=None, marker=None, cmap=None, norm=None, vmin=None, vmax=None, alpha=None, linewidths=None, verts=None, edgecolors=None, *, data=None, **kwargs)

参数的解释:

### x,y:表示的是大小为(n,)的数组,即绘制散点图的数据点

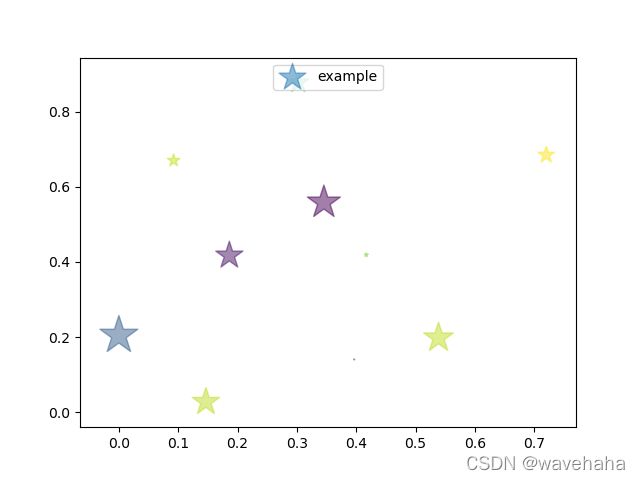
### s:是一个实数或者是一个数组大小为(n,),这个是一个可选的参数,表示点的面积,若只有一个实数,表示面积大小相等。

### c:表示的是颜色,也是一个可选项。默认是蓝色'b',表示的是标记的颜色,或者可以是一个表示颜色的字符,或者是一个长度为n的表示颜色的序列等等,感觉还没用到过现在不解释了。但是c不可以是一个单独的RGB数字,也不可以是一个RGBA的序列。可以是他们的2维数组(只有一行)。

### marker:表示的是标记的样式,默认的是'o'。

### cmap:Colormap实体或者是一个colormap的名字,cmap仅仅当c是一个浮点数数组的时候才使用。如果没有申明就是image.cmap

### norm:Normalize实体来将数据亮度转化到0-1之间,也是只有c是一个浮点数的数组的时候才使用。如果没有申明,就是默认为colors.Normalize。

### vmin,vmax:实数,当norm存在的时候忽略。用来进行亮度数据的归一化。

### alpha:实数,0-1之间,表示点的透明度。
例如:
import numpy as np
import matplotlib.pyplot as plt

np.random.seed(1)
x = np.random.rand(10)
y = np.random.rand(10)

colors = np.random.rand(10)
area = (30 * np.random.rand(10)) ** 2

plt.scatter(x, y, s=area, c=colors, alpha=0.5, label='example', marker='*')
plt.legend(loc='upper center')
plt.show()
· 3D散点图
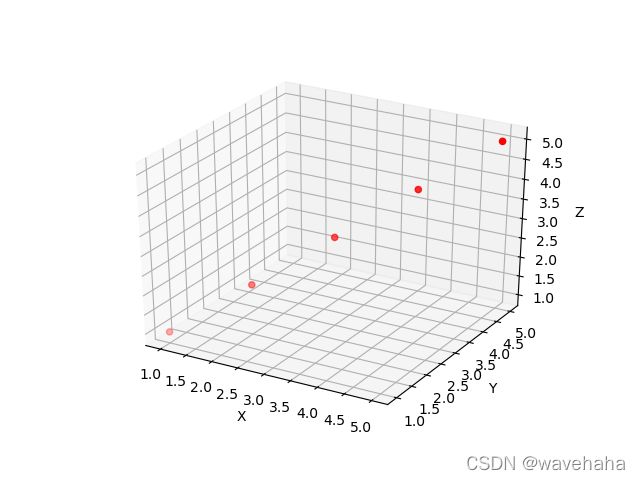
1.使用matplotlib.pyplot
import scipy.io as sio
from mpl_toolkits.mplot3d import Axes3D
import matplotlib.pyplot as plt

a = [1, 2, 3, 4, 5]
b = [1, 2, 3, 4, 5]
c = [1, 2, 3, 4, 5]

ax = plt.subplot(111, projection='3d')
ax.scatter(a, b, c, c='r')
ax.set_zlabel('Z')
ax.set_ylabel('Y')
ax.set_xlabel('X')
plt.show()
2.使用pyplot
了解:可视化神器Plotly绘制3D图形 - 知乎 (zhihu.com)
官网:https://plotly.com/python/plotly-express/
http://t.zoukankan.com/traditional-p-12409410.html
该模块保存图片,要使用:
import plotly.io as pio

####################################

pio.write_image(fig, save_path)
例如:
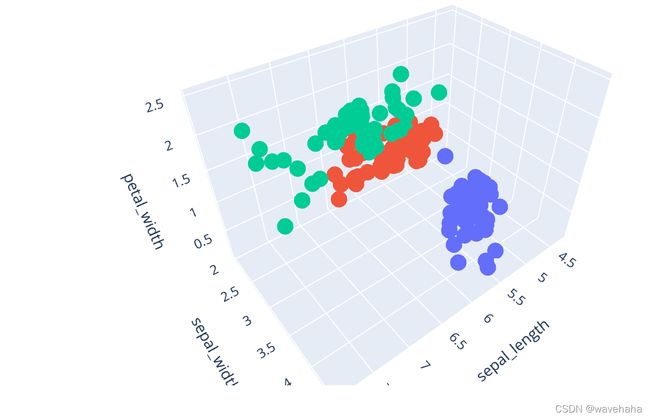
import plotly.express as px
df = px.data.iris()
fig = px.scatter_3d(df, x='sepal_length', y='sepal_width', z='petal_width',
              color='species')
fig.show()
· 3D柱状图(bar3d)
1. 一般用法
import numpy as np
import matplotlib.pyplot as plt
from mpl_toolkits.mplot3d import Axes3D

# 绘图设置
fig = plt.figure()
ax = fig.gca(projection='3d')  # 三维坐标轴
# X和Y的个数要相同
X = [1, 2, 3, 4]
Y = [5, 6, 7, 8]
Z = np.random.randint(0, 1000, 16)  # 生成16个随机整数
print(len(Z))
# meshgrid把X和Y变成平方长度,比如原来都是4,经过meshgrid和ravel之后,长度都变成了16,因为网格点是16个
xx, yy = np.meshgrid(X, Y)  # 网格化坐标
X, Y = xx.ravel(), yy.ravel()  # 矩阵扁平化
# 设置柱子属性
height = np.zeros_like(Z)  # 新建全0数组,shape和Z相同,据说是图中底部的位置
width = depth = 0.3  # 柱子的长和宽
# 颜色数组,长度和Z一致
c = ['#313695', '#4575b4', '#74add1', '#abd9e9', '#e0f3f8', '#ffffbf', '#fee090', '#fdae61'] * 2
# 开始画图,注意本来的顺序是X, Y, Z, width, depth, height,但是那样会导致不能形成柱子,只有柱子顶端薄片,所以Z和height要互换
ax.bar3d(X, Y, height, width, depth, Z, color=c, shade=False)  # width, depth, height
ax.set_xlabel('X')
ax.set_ylabel('Y')
ax.set_zlabel('Z')
plt.show()
· 热力图
参考:
https://www.jb51.net/article/171016.htm
https://www.jb51.net/article/150368.htm
https://www.jb51.net/article/150436.htm
https://www.zhihu.com/question/304453510
https://blog.csdn.net/weixin_39541558/article/details/79813936
可以使用echarts的热力图:官网:Apache ECharts
参考:https://github.com/pyecharts/pyecharts
· Matplotlib添加图形标记MarkerStyle
matplotlib.markers.MarkerStyle — Matplotlib 3.5.1 documentation
matplotlib包含以下图形标记:
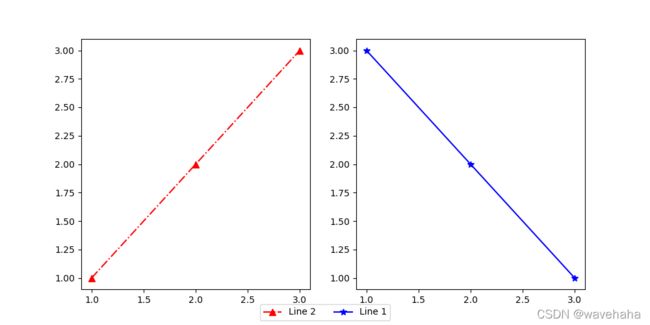
markers = {‘.’: ‘point’, ‘,’: ‘pixel’, ‘o’: ‘circle’, ‘v’: ‘triangle_down’, ‘^’: ‘triangle_up’, ‘<’: ‘triangle_left’, ‘>’: ‘triangle_right’, ‘1’: ‘tri_down’, ‘2’: ‘tri_up’, ‘3’: ‘tri_left’, ‘4’: ‘tri_right’, ‘8’: ‘octagon’, ‘s’: ‘square’, ‘p’: ‘pentagon’, ‘*’: ‘star’, ‘h’: ‘hexagon1’, ‘H’: ‘hexagon2’, ‘+’: ‘plus’, ‘x’: ‘x’, ‘D’: ‘diamond’, ‘d’: ‘thin_diamond’, ‘|’: ‘vline’, ‘_’: ‘hline’, ‘P’: ‘plus_filled’, ‘X’: ‘x_filled’, 0: ‘tickleft’, 1: ‘tickright’, 2: ‘tickup’, 3: ‘tickdown’, 4: ‘caretleft’, 5: ‘caretright’, 6: ‘caretup’, 7: ‘caretdown’, 8: ‘caretleftbase’, 9: ‘caretrightbase’, 10: ‘caretupbase’, 11: ‘caretdownbase’, ‘None’: ‘nothing’, None: ‘nothing’, ’ ‘: ‘nothing’, ”: ‘nothing’}
例如:
import matplotlib.pyplot as plt

fig = plt.figure(figsize=(10, 5))
ax1 = fig.add_subplot(121)
x = [1, 2, 3]
line_up, = plt.plot(x, [1, 2, 3], label='Line 2', color='red', linestyle='-.', marker='^', markersize='7')####
ax2 = fig.add_subplot(122)
line_down, = plt.plot(x, [3, 2, 1], label='Line 1', color='blue', linestyle='-', marker='*', markersize='7')####
lines = []
labels = []
for ax in fig.axes:
    axLine, axLabel = ax.get_legend_handles_labels()
    lines.extend(axLine)
    labels.extend(axLabel)
fig.legend(lines, labels, loc='lower center', ncol=2)
plt.show()
· Matplotlib添加图例
Legend guide — Matplotlib 2.0.2 documentation
plt.legend常用参数:plt.legend(handles, labels, loc, ncol)
图例涉及的线及标签:
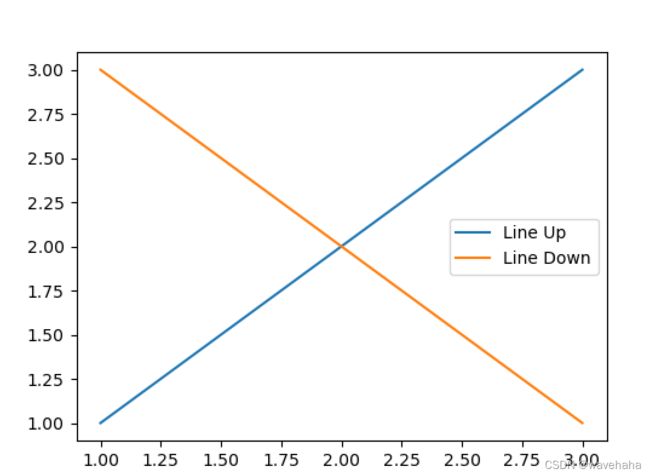
单图图例:
import matplotlib.pyplot as plt

fig = plt.figure(figsize=(13, 10))
x = [1, 2, 3]
line_up, = plt.plot(x, [1, 2, 3], label='Line 2')
line_down, = plt.plot(x, [3, 2, 1], label='Line 1')
plt.legend([line_up, line_down], ['Line Up', 'Line Down'])
plt.show()
多图图例:
(3条消息) Matplotlib 多个子图使用一个图例_lzw790222124的博客-CSDN博客_matplotlib子图共用图例
对于多子图可以使用以下代码同时获取所有线和标签:
handles, labels = ax.get_legend_handles_labels()
ax.legend(handles, labels)
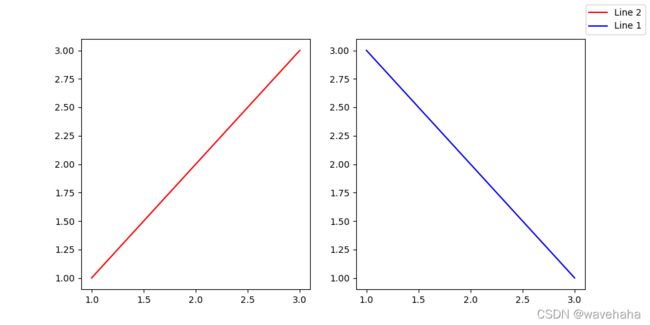
例如1:所有的子图图例不同
import matplotlib.pyplot as plt

fig = plt.figure(figsize=(10, 5))
ax1 = fig.add_subplot(121)
x = [1, 2, 3]
line_up, = plt.plot(x, [1, 2, 3], label='Line 2')
ax2 = fig.add_subplot(122)
line_down, = plt.plot(x, [3, 2, 1], label='Line 1')
lines = []
labels = []
for ax in fig.axes:
    axLine, axLabel = ax.get_legend_handles_labels()
    lines.extend(axLine)
    labels.extend(axLabel)

fig.legend(lines, labels)
plt.show()
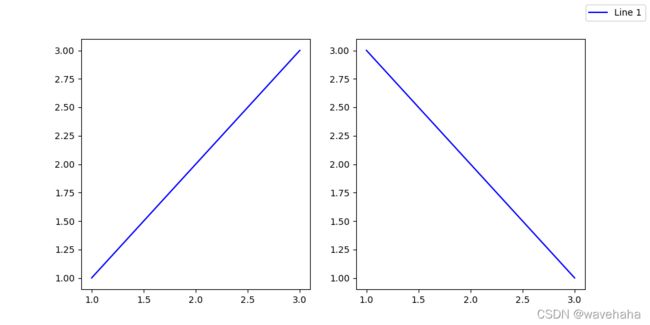
例如2:所有的子图图例相同
import matplotlib.pyplot as plt

fig = plt.figure(figsize=(10, 5))
ax1 = fig.add_subplot(121)
x = [1, 2, 3]
line_up, = plt.plot(x, [1, 2, 3], label='Line 2', color='blue')
ax2 = fig.add_subplot(122)
line_down, = plt.plot(x, [3, 2, 1], label='Line 1', color='blue')
lines, labels = fig.axes[-1].get_legend_handles_labels()
fig.legend(lines, labels)
plt.show()
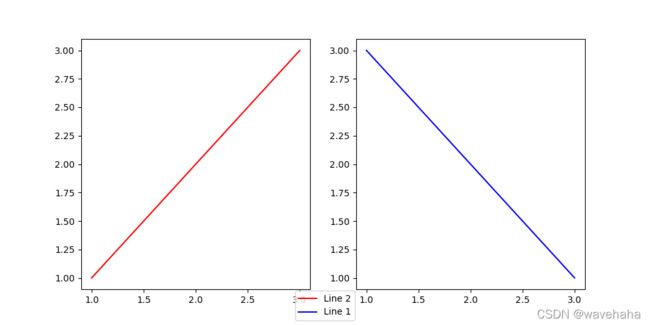
图例放置位置:
plt.legend(local='best') # 有best/upper right/upper left/lower left/lower right/right/center left/center right/lower center/upper center/center
例如:
import matplotlib.pyplot as plt

fig = plt.figure(figsize=(10, 5))
ax1 = fig.add_subplot(121)
x = [1, 2, 3]
line_up, = plt.plot(x, [1, 2, 3], label='Line 2', color='red')
ax2 = fig.add_subplot(122)
line_down, = plt.plot(x, [3, 2, 1], label='Line 1', color='blue')
lines = []
labels = []
for ax in fig.axes:
    axLine, axLabel = ax.get_legend_handles_labels()
    lines.extend(axLine)
    labels.extend(axLabel)
fig.legend(lines, labels, loc='lower center')
plt.show()
图例横向放置(图例分割):
plt.legend(ncol=2)
ncol表示将图例分为几份,若共有5个,设置ncol=5则竖向图例可以变为横向图例。
例如:
import matplotlib.pyplot as plt

fig = plt.figure(figsize=(10, 5))
ax1 = fig.add_subplot(121)
x = [1, 2, 3]
line_up, = plt.plot(x, [1, 2, 3], label='Line 2', color='red')
ax2 = fig.add_subplot(122)
line_down, = plt.plot(x, [3, 2, 1], label='Line 1', color='blue')
lines = []
labels = []
for ax in fig.axes:
    axLine, axLabel = ax.get_legend_handles_labels()
    lines.extend(axLine)
    labels.extend(axLabel)
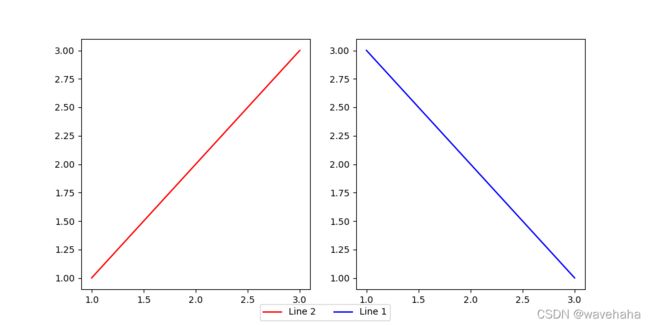
fig.legend(lines, labels, loc='lower center', ncol=2)
plt.show()
· Matplotlib设置colorbar
(3条消息) matplotlib为多个子图设置同一个colorbar_Mr.horse的博客-CSDN博客_plt.subplot如何将每行图像加colorbar
· Matplotlib常用设置
1. matplotlib.pyplot.gcf(),当前图表可以使用plt.gcf()获得
2.matplotlib.pyplot.gca(),获取当前坐标轴,然后对不同坐标轴个性化
参考:Matplotlib入门-3-plt.gca( )挪动坐标轴 - 知乎 (zhihu.com)
import numpy as np
import matplotlib.pyplot as plt

np.random.seed(1)
x = np.random.rand(10)
y = np.random.rand(10)

colors = np.random.rand(10)
area = (30 * np.random.rand(10)) ** 2
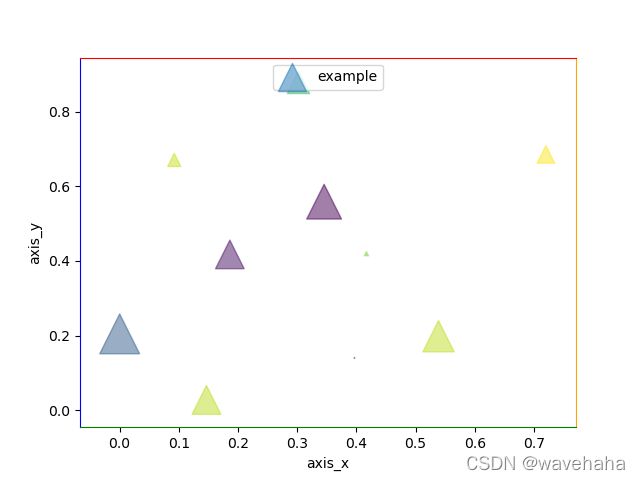
ax = plt.gca()
ax.spines['bottom'].set_color('green') ####
ax.spines['top'].set_color('red')  ####
ax.spines['left'].set_color('blue')  ####
ax.spines['right'].set_color('orange')  ####
ax.set_xlabel('axis_x')  ####
ax.set_ylabel('axis_y')  ####
plt.scatter(x, y, s=area, c=colors, alpha=0.5, label='example', marker='x')
plt.legend(loc='upper center')
plt.show()
3.matplotlib.pyplot.grid()设置网格线
plt.grid(linestyle=":", color="b")

· linestyle:线型
· color:线条颜色
import matplotlib.pyplot as plt

fig = plt.figure(figsize=(10, 5))
ax1 = fig.add_subplot(121)
x = [1, 2, 3]
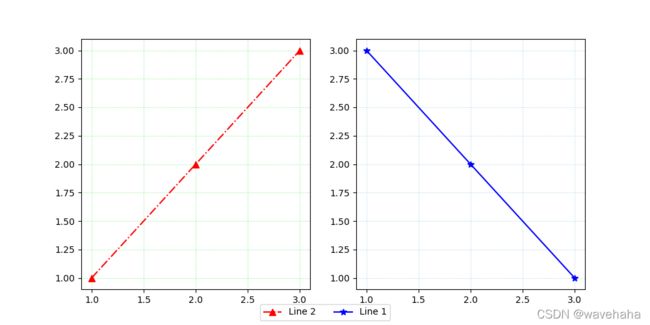
line_up, = plt.plot(x, [1, 2, 3], label='Line 2', color='red', linestyle='-.', marker='^', markersize='7')
plt.grid(linestyle=":", color="lightgreen")
ax2 = fig.add_subplot(122)
line_down, = plt.plot(x, [3, 2, 1], label='Line 1', color='blue', linestyle='-', marker='*', markersize='7')
# plt.legend([line_up, line_down], ['Line Up', 'Line Down'])
lines = []
labels = []
for ax in fig.axes:
    axLine, axLabel = ax.get_legend_handles_labels()
    lines.extend(axLine)
    labels.extend(axLabel)
fig.legend(lines, labels, loc='lower center', ncol=2)
plt.grid(linestyle=":", color="lightblue")
plt.show()
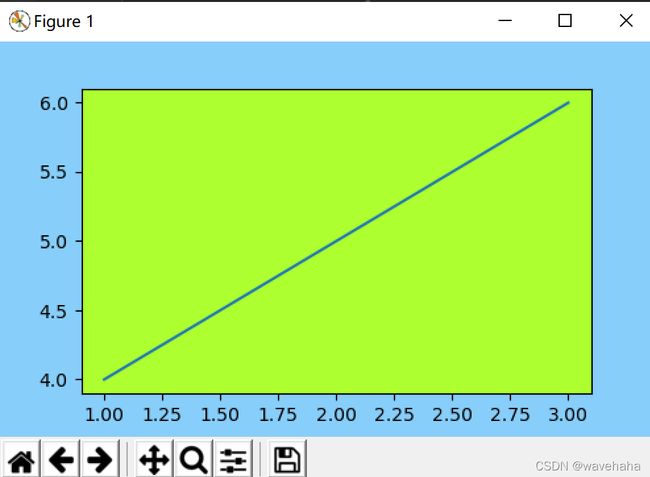
4. 设置前景色、背景色
import matplotlib.pyplot as plt

x = [1, 2, 3]
y = [4, 5, 6]
fig = plt.figure(figsize=(5,3))
ax = fig.add_subplot(111)
ax.patch.set_facecolor('greenyellow')
fig.patch.set_facecolor('lightskyblue')
plt.plot(x, y)
plt.show()
5. 设置标题matplotlib.pyplot.title()
参考:(3条消息) matplotlib命令与格式:标题(title),标注(annotate),文字说明(text)_开码河粉-CSDN博客_title
常用参数:
## fontsize设置字体大小,默认12,可选参数 ['xx-small', 'x-small', 'small', 'medium', 'large','x-large', 'xx-large']
## fontweight设置字体粗细,可选参数 ['light', 'normal', 'medium', 'semibold', 'bold', 'heavy', 'black']
## fontstyle设置字体类型,可选参数[ 'normal' | 'italic' | 'oblique' ],italic斜体,oblique倾斜
## verticalalignment设置水平对齐方式 ,可选参数 : 'center' , 'top' , 'bottom' ,'baseline'
## horizontalalignment设置垂直对齐方式,可选参数:left,right,center
## rotation(旋转角度)可选参数为:vertical,horizontal 也可以为数字
## alpha透明度,参数值0至1之间
## backgroundcolor标题背景颜色
## bbox给标题增加外框 ,常用参数如下:
## boxstyle方框外形
## facecolor(简写fc)背景颜色
## edgecolor(简写ec)边框线条颜色
## edgewidth边框线条大小
6. 修改坐标刻度 matplotlib.pyplot.tick_params()
包括2D、3D,参考:(3条消息) Python + matplotlib更改纵横坐标刻度颜色_TBTB的博客-CSDN博客_matplotlib 坐标轴颜色
可以修改颜色、大小等。
plt.tick_params(axis='x',colors='red')
plt.tick_params(labelsize='small')
例子:
plt.tick_params(axis='x', colors='gray')
plt.tick_params(axis='y', colors='gray')
plt.tick_params(axis='z', colors='gray')
7. 去掉坐标轴、去掉坐标轴刻度
参考:python 画图工具matplotlib 去掉坐标轴和坐标的方法 - senyang - 博客园 (cnblogs.com)
plt.xticks([])  #去掉横坐标值
plt.yticks([])  #去掉纵坐标值
plt.axis('off')
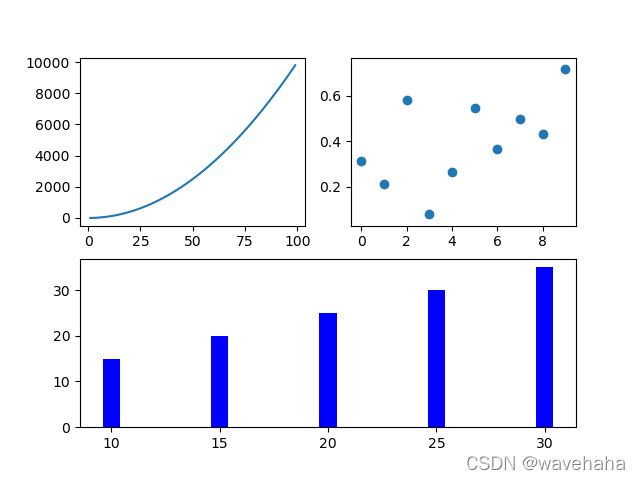
8. 子图绘制(三种方法)
参考:Matplotlib如何绘制子图 - 雪山飞猪 - 博客园 (cnblogs.com)
方式一:通过plt的subplot
import numpy as np
import pandas as pd
import matplotlib.pyplot as plt
# author: chenqionghe

# 画第1个图:折线图
x=np.arange(1,100)
plt.subplot(221)
plt.plot(x,x*x)

# 画第2个图:散点图
plt.subplot(222)
plt.scatter(np.arange(0,10), np.random.rand(10))

# 画第3个图:饼图
plt.subplot(223)
plt.pie(x=[15,30,45,10],labels=list('ABCD'),autopct='%.0f',explode=[0,0.05,0,0])

# 画第4个图:条形图
plt.subplot(224)
plt.bar([20,10,30,25,15],[25,15,35,30,20],color='b')
plt.show()
方式二:通过figure的add_subplot
import numpy as np
import pandas as pd
import matplotlib.pyplot as plt
# author: chenqionghe

fig=plt.figure()

# 画第1个图:折线图
x=np.arange(1,100)
ax1=fig.add_subplot(221)
ax1.plot(x,x*x)

# 画第2个图:散点图
ax2=fig.add_subplot(222)
ax2.scatter(np.arange(0,10), np.random.rand(10))

# 画第3个图:饼图
ax3=fig.add_subplot(223)
ax3.pie(x=[15,30,45,10],labels=list('ABCD'),autopct='%.0f',explode=[0,0.05,0,0])

# 画第4个图:条形图
ax4=fig.add_subplot(224)
ax4.bar([20,10,30,25,15],[25,15,35,30,20],color='b')
plt.show()
方式三:通过plt的subplots
import numpy as np
import pandas as pd
import matplotlib.pyplot as plt
# author: chenqionghe

fig,subs=plt.subplots(2,2)

# 画第1个图:折线图
x=np.arange(1,100)
subs[0][0].plot(x,x*x)

# 画第2个图:散点图
subs[0][1].scatter(np.arange(0,10), np.random.rand(10))

# 画第3个图:饼图
subs[1][0].pie(x=[15,30,45,10],labels=list('ABCD'),autopct='%.0f',explode=[0,0.05,0,0])

# 画第4个图:条形图
subs[1][1].bar([20,10,30,25,15],[25,15,35,30,20],color='b')
plt.show()
例如:
import numpy as np
import pandas as pd
import matplotlib.pyplot as plt
# author: chenqionghe

# 画第1个图:折线图
x=np.arange(1,100)
plt.subplot(221)
plt.plot(x,x*x)

# 画第2个图:散点图
plt.subplot(222)
plt.scatter(np.arange(0,10), np.random.rand(10))

# 画第3个图:饼图
plt.subplot(223)
plt.pie(x=[15,30,45,10],labels=list('ABCD'),autopct='%.0f',explode=[0,0.05,0,0])

# 画第3个图:条形图
# 前面的两个图占了221和222的位置,如果想在下面只放一个图,得把前两个当成一列,即2行1列第2个位置
plt.subplot(212)
plt.bar([20,10,30,25,15],[25,15,35,30,20],color='b')
plt.show()
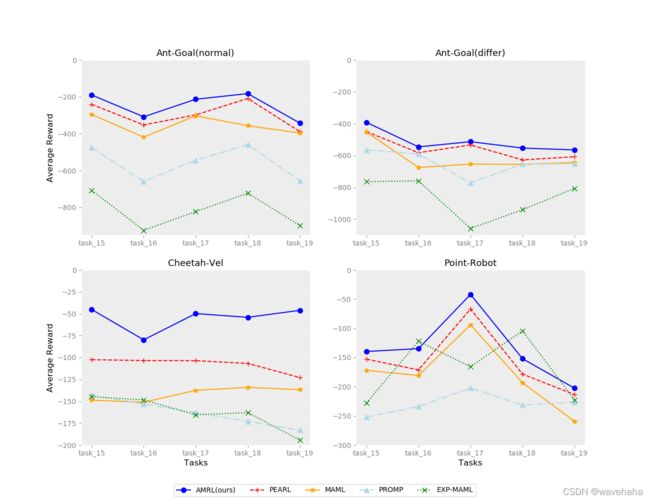
9. 设置坐标轴刻度和阈值
labels = ['task_15', 'task_16', 'task_17', 'task_18', 'task_19']
plt.xticks(x, labels)  # 设置刻度
plt.ylim([-1100, 0])  # 设置阈值
例如:
fig = plt.figure(figsize=(13, 10))
ax1 = fig.add_subplot(221)
ax1.patch.set_facecolor(np.ones(3)* 237 / 255)
plt.plot(x, ant_goal_nomal, color='blue', label='AMRL(ours)', marker='o', markersize='7')
plt.plot(x, baseline_PEARL_normal, color='red', label='PEARL', linestyle='--', marker='+', markersize='7')
plt.plot(x, baseline_MAML_normal, color='orange', label='MAML', linestyle='-', marker='*', markersize='7')
plt.plot(x, baseline_PROMP_normal, color='lightblue', label='PROMP', linestyle='-.', marker='^', markersize='7')
plt.plot(x, baseline_EXPMAML_normal, color='green', label='EXP-MAML', linestyle=':', marker='x', markersize='7')
labels = ['task_15', 'task_16', 'task_17', 'task_18', 'task_19']
plt.xticks(x, labels)
# plt.xlabel('Tasks', color='black', fontsize='12')  # X轴标签
plt.ylabel('Average Reward', color='black', fontsize='12')  # Y轴标签
plt.title("Ant-Goal(normal)", fontsize='13')
# plt.legend(loc="upper right")
ax1.spines['bottom'].set_color('white')
ax1.spines['top'].set_color('white')
ax1.spines['left'].set_color('white')
ax1.spines['right'].set_color('white')
plt.ylim([-950, 0])
plt.tick_params(axis='x', colors='gray')
plt.tick_params(axis='y', colors='gray')
# plt.tick_params(labelsize='20')
plt.grid(linestyle=":", color="white")
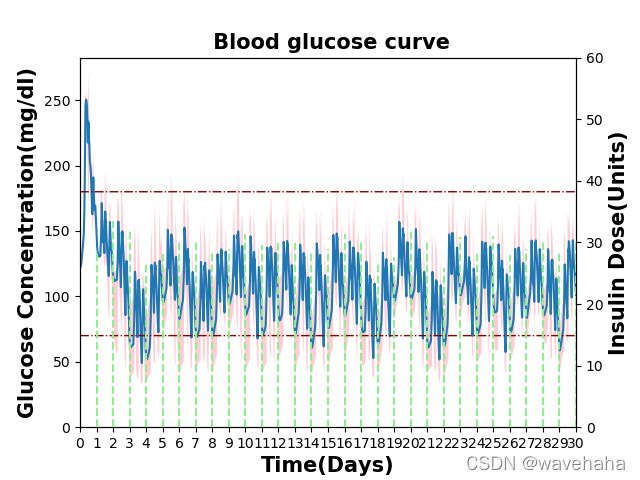
10. 设置双坐标
fig, ax1 = plt.subplots()
ax2 = ax1.twinx()  # 做镜像处理,双坐标轴
例如:
fig, ax1 = plt.subplots()
ax2 = ax1.twinx()  # 做镜像处理,双坐标轴

x = range(43200)  #只画30天
ax1.plot(x, mean_state, color='#1f77b4')
ax1.fill_between(x, min_state, max_state,  # 上限,下限
# facecolor='thistle',  # 填充颜色
facecolor='pink',  # 填充颜色
# edgecolor='red',  # 边界颜色
alpha=0.8)  # 透明度
base_min = [70] * 43200
base_max = [180] * 43200
ax1.plot(x, base_min, color='darkred', linewidth=1, linestyle="-.")
ax1.plot(x, base_max, color='darkred', linewidth=1, linestyle="-.")
# for n in range(0, 1440):
for n in range(0, 60):
# print(start_point[n])
# print(end_point[n])
ax2.plot(start_point[n], end_point[n], '--', color='lightgreen')

new_ticks = list(range(0, 86400, 1440))
# print(new_ticks)
new_labels = [str(i) for i in range(0, 60)]
# print(new_labels)
plt.xticks(new_ticks, new_labels)
ax1.set_xlabel('Time(Days)', weight='bold', size=15)  # X轴标签
ax1.set_ylabel('Glucose Concentration(mg/dl)', weight='bold', size=15)  # Y轴标签
ax2.set_ylabel('Insulin Dose(Units)', weight='bold', size=15)
plt.title(" Blood glucose curve", weight='bold', size=15)
plt.xlim([0, 43200])
ax2.set_ylim([0, 60])
ax1.set_ylim(ymin=0)
· Matplotlib常见问题:
1.为什么使用python画散点图保存后空白
plt.savefig()应该在plt.show()之前,即图形展示应在图形保存之后,否则会空白。
2.RuntimeWarning: More than 20 figures have been opened.
因为循环频繁画图导致的错误,可以在每次循环后将图片关闭:plt.close()
