决策树ID3算法实现(python实现)
决策树算法
决策树理论及概念
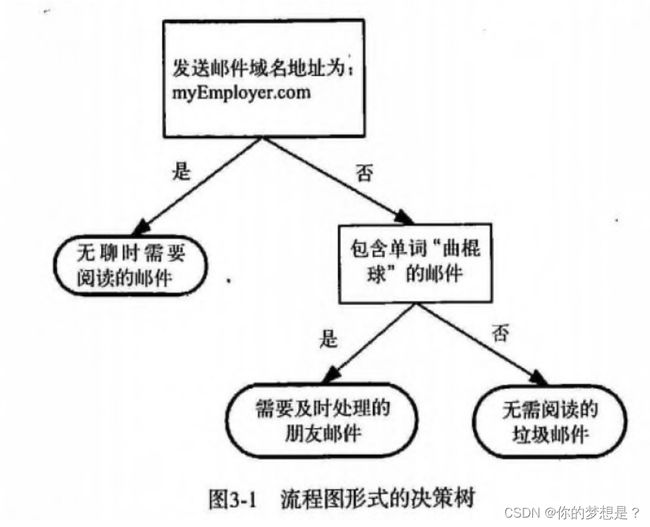
长方形代表判断模块,椭圆形代表终止模块,从判断模块引用出来的箭头代表分支,如图构造了假象的邮件分类系统
构造决策树的过程:
首先在数据集所有特征中上找到在数据分类过程中最好的起决定性的的特征,在找的过程中,就需要评估每个特征,之后数据集会根据特征决策点划分为几个分支数据,如果某个分支下的数据同属于一个类型,则该分支已经正确的划分数据分类,否则需要重复划分数据子集,直到所有具有相同类型的数据均在一个数据集中,划分过程与对原始数据集划分过程相同。创建分支函数的伪代码如下:
检测数据集中每个子项是否属于同一分类:
	if so return 类标签;
	else
    	寻找划分数据的最好特征
        划分数据集
        创建分支节点
        	for 每个划分的子集
            	调用创建分支函数并增加返回结果到分支节点中
        return 分支节点
决策树的一般流程:
1.收集数据
2.准备数据:决策树算法只适合标称型数据,对于数值数据必须离散化
3.分析数据:构造树之后,检查图形是否符合预期
4.训练算法:构造树的数据结构
5.测试算法:使用经验树来计算错误率
6.使用算法
信息增益
信息:用来定义数据反应的信息量,概率越大,反应的信息量越小
l ( x i ) = − l o g 2 p ( x i ) ( 1 ) l(x_i)=-log_2p(x_i)\quad\quad\quad(1) l(xi)=−log2p(xi)(1)
信息熵:用来判断数据的有序性,熵值越小数据越有序,熵值越大,不确定性也越大,熵计算公式为
H = − ∑ i = 1 n p ( x i ) l o g 2 p ( x i ) ( 2 ) H=-\sum_{i=1}^{n}p(x_i)log_2p(x_i)\quad\quad\quad(2) H=−i=1∑np(xi)log2p(xi)(2)
条件熵:再给定条件 X X X下,随机变量 Y Y Y的条件概率分布的熵对 X X X的数学期望,可能有些绕口,下面案例解释
H ( Y ∣ X ) = ∑ i = 0 n p i H ( Y ∣ X = x i ) ( 3 ) H(Y|X)=\sum_{i=0}^{n}p_iH(Y|X=x_i)\quad\quad\quad(3) H(Y∣X)=i=0∑npiH(Y∣X=xi)(3)
信息增益:特征A对训练数据集D的信息增益,定义为集合D的熵 H ( D ) H(D) H(D)与特征值A给定条件下D的条件熵 H ( D ∣ A ) H(D|A) H(D∣A)之差。
G a i n ( D , A ) = H ( D ) − H ( D ∣ A ) Gain(D,A)=H(D)-H(D|A) Gain(D,A)=H(D)−H(D∣A)
基本概念了解后,来做个简单测验加深理解,这里有一份是否贷款的数据集

简单从没划分数据集理解
p ( 贷款 ) = 9 15 p ( 不贷款 ) = 6 15 H = − 9 15 ∗ l o g 2 ( 9 15 ) − 6 15 ∗ l o g 2 ( 6 15 ) p(贷款)=\frac{9}{15}\quad\quad\quad\quad p(不贷款)=\frac{6}{15}\\H=-\frac{9}{15}*log_2(\frac{9}{15})-\frac{6}{15}*log_2(\frac{6}{15}) p(贷款)=159p(不贷款)=156H=−159∗log2(159)−156∗log2(156)
如果此时按照年龄划分后
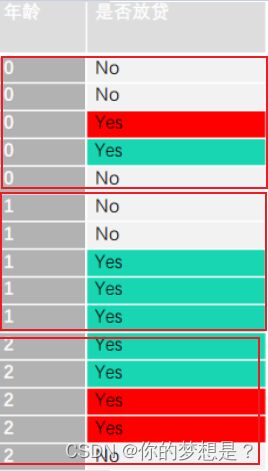
a g e = 0 p ( 贷款 ) = 2 5 p ( 不贷款 ) = 3 5 H ( a g e = 0 ) = − 2 5 ∗ l o g 2 ( 2 5 ) − 3 5 ∗ l o g 2 ( 3 5 ) H ( a g e = 1 ) = − 2 5 ∗ l o g 2 ( 2 5 ) − 3 5 ∗ l o g 2 ( 3 5 ) H ( a g e = 2 ) − 4 5 ∗ l o g 2 ( 4 5 ) − 1 5 ∗ l o g 2 ( 1 5 ) H ( X ∣ a g e ) = 5 15 ∗ H ( a g e = 0 ) + 5 15 ∗ H ( a g e = 2 ) + 5 15 ∗ H ( a g e = 0 ) G a i n ( x , a g e ) = H − H ( X ∣ a g e ) age=0\\p(贷款)=\frac{2}{5}\quad\quad p(不贷款)=\frac{3}{5}\\H(age=0)=-\frac{2}{5}*log_2(\frac{2}{5})-\frac{3}{5}*log_2(\frac{3}{5})\\H(age=1)=-\frac{2}{5}*log_2(\frac{2}{5})-\frac{3}{5}*log_2(\frac{3}{5})\\H(age=2)-\frac{4}{5}*log_2(\frac{4}{5})-\frac{1}{5}*log_2(\frac{1}{5})\\ H(X|age)=\frac{5}{15}*H(age=0)+\frac{5}{15}*H(age=2)+\frac{5}{15}*H(age=0)\\Gain(x,age)=H-H(X|age) age=0p(贷款)=52p(不贷款)=53H(age=0)=−52∗log2(52)−53∗log2(53)H(age=1)=−52∗log2(52)−53∗log2(53)H(age=2)−54∗log2(54)−51∗log2(51)H(X∣age)=155∗H(age=0)+155∗H(age=2)+155∗H(age=0)Gain(x,age)=H−H(X∣age)
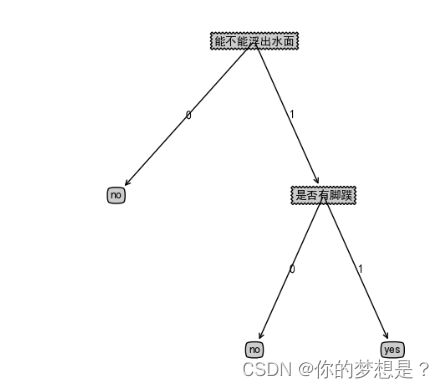
简单决策树算法判断是否是鱼类
1.使用简单数据集构建决策树
#导入第三方科学计算包
from numpy import *
#导入数学函数包
from math import log
#导入运算符模块
import operator
#计算给定数据集的熵
def calcShannonEnt(dataSet):
    numEntries=len(dataSet)
    labelCounts={}
    for featVec in dataSet:
        currentLabel=featVec[-1]
        if currentLabel not in labelCounts.keys():
            labelCounts[currentLabel]=0
        labelCounts[currentLabel]+=1
    shannonEnt=0.0
    #计算熵公式
    for key in labelCounts:
        prob=float(labelCounts[key]/numEntries)
        shannonEnt-=prob*log(prob,2)
    return shannonEnt

#定义简单数据集
def createDataSet():
    dataSet=[
        [1,1,'yes'],
        [1,1,'yes'],
        [1,0,'no'],
        [0,1,'no'],
        [0,1,'no']
    ]
    labels=["能不能浮出水面","是否有脚蹼"]
    return dataSet,labels

#按照给定特征划分数据集
def splitDataSet(dataSet,axis,value):
    retDataSet=[]
    # 根据特征下标和特征值来划分数据集
    for featVec in dataSet:
        if featVec[axis]==value:
            reducedFeatVec=featVec[:axis]
            reducedFeatVec.extend(featVec[axis+1:])
            retDataSet.append(reducedFeatVec)
    return retDataSet

#选择最好的数据划分方式
def chooseBestFeatureToSplit(dataSet):
    numFeatures=len(dataSet[0])-1
    baseEntropy=calcShannonEnt(dataSet)
    bestInfoGain=0.0
    #最好特征下标
    bestFeature=-1
    for i in range(numFeatures):
        featList=[example[i] for example in dataSet]
        uniqueVals=set(featList)
        newEntropy=0.0
        #计算经过特征值划分之后的熵
        for value in uniqueVals:
            subDataSet =splitDataSet(dataSet,i,value)
            prob=len(subDataSet)/float(len(dataSet))
            newEntropy+=prob*calcShannonEnt(subDataSet)
        #计算经划分后的信息增益
        infoGain=baseEntropy-newEntropy
        #选择最大信息增益作为最好特征值
        if (infoGain>bestInfoGain):
            bestInfoGain=infoGain
            bestFeature=i
    return bestFeature
#定义多数表决的方法来决定数据划分到最后仍不是唯一的分类标签
def majorityCnt(classList):
    classCount={}
    #统计不是唯一分类数据中分类标签出现的次数
    for vote in classList:
        if vote not in classCount.keys():
            classCount[vote]=0
        classCount[vote]+=1
    #选择分类次数出现多的作为该数据的类别
    sortedClassCount=sorted(classCount.items(),key=operator.itemgetter(1),reverse=True)
    return sortedClassCount[0][0]
#构建决策树
def createTree(dataSet,labels):
    #将数据集中的类别到新列表中
    classList=[example[-1] for example in dataSet]
    #根据数据集中类别标签是否一致或者特征列表只剩类别特征来决定数据的类别
    if classList.count(classList[0])==len(classList):
        return classList[0]
    if len(dataSet[0])==1:
        return majorityCnt(classList)
    #选择最好的特征划分数据集
    bestFeat=chooseBestFeatureToSplit(dataSet)
    bestFeatLabel=labels[bestFeat]
    myTree={bestFeatLabel:{}}
    del (labels[bestFeat])
    featValues=[example[bestFeat] for example in dataSet]
    uniqueVals=set(featValues)
    #根据最好特征的特征值划分分支
    for value in uniqueVals:
        subLabels=labels[:]
        myTree[bestFeatLabel][value]=createTree(splitDataSet(dataSet,bestFeat,value),subLabels)
    return myTree
#使用决策树预测未知分类数据
def classfiy(inputTree,featLabls,testVec):
    firstStr=list(inputTree.keys())[0]
    secondDict=inputTree[firstStr]
    featIndex=featLabls.index(firstStr)
    for key in secondDict.keys():
        if testVec[featIndex]==key:
            if type(secondDict[key]).__name__=='dict':
                classLabel=classfiy(secondDict[key],featLabls,testVec)
            else:
                classLabel=secondDict[key]
    return classLabel
#测试
if __name__=="__main__":
    myData,labels=createDataSet()
    print(f"熵是{calcShannonEnt(myData)}")
    # myData=splitDataSet(myData,0,1)
    # print(f"划分之后的结果{myData}")
    # print(f"最好的划分特征是{chooseBestFeatureToSplit(myData)}")
    myTree=createTree(myData,labels)
    myData, labels = createDataSet()
    print(classfiy(myTree,labels,[0,0]))
    print(labels)
2.绘制决策树
#导入matplotlb画图包
import matplotlib.pyplot as plt
#导入处理后的决策树数据
import trees as mytree
descisionNode=dict(boxstyle="sawtooth",fc="0.8")
leafNode=dict(boxstyle="round4",fc="0.8")
arrow_args=dict(arrowstyle="<-")
ax=None
totalW=None
totalD=None
xOff=None
yOff=None

#绘制带箭头的注解
def plotNode(nodeTxt,centerPt,parentPt,nodeType):
    ax.annotate(nodeTxt,xy=parentPt,xycoords='axes fraction',xytext=centerPt,textcoords='axes fraction',\
    va="center",ha="center",bbox=nodeType,arrowprops=arrow_args)


#获取叶子节点的数目和树的层次
def getNumLeafs(myTree):
    numLeafs=0
    firStr=list(myTree.keys())[0]
    secondDict=myTree[firStr]
    for key in secondDict.keys():
        if type(secondDict[key]).__name__=='dict':
            numLeafs+=getNumLeafs(secondDict[key])
        else:
            numLeafs+=1
    return numLeafs
#获取树的层次
def getTreeDepth(myTree):
    maxDepth=0
    firstStr=list(myTree.keys())[0]
    secondDict=myTree[firstStr]
    for key in secondDict.keys():
        if type(secondDict[key]).__name__=='dict':
            thisDepth=1+getTreeDepth(secondDict[key])
        else:
            thisDepth=1
        if thisDepth>maxDepth:
            maxDepth=thisDepth
    return maxDepth

#在分支上显示基于特征值划分判断值
def plotMidText(cntrPt,parentPt,txtString):
    xMid=(parentPt[0]-cntrPt[0])/2.0+cntrPt[0]
    yMid=(parentPt[1]-cntrPt[1])/2.0+cntrPt[1]
    ax.text(xMid,yMid,txtString)
#绘制决策树的节点
def plotTree(myTree,parentPt,nodeTxt):
    global yOff
    global xOff
    numLeafs=getNumLeafs(myTree)
    depth=getTreeDepth(myTree)
    firstStr=list(myTree.keys())[0]
    cntrPt=(xOff+float(1+float(numLeafs))/2.0/totalW,yOff)
    plotMidText(cntrPt,parentPt,nodeTxt)
    plotNode(firstStr,cntrPt,parentPt,descisionNode)
    secondDict=myTree[firstStr]
    yOff=yOff-1.0/totalD
    for key in secondDict.keys():
        if type(secondDict[key]).__name__=='dict':
            plotTree(secondDict[key],cntrPt,str(key))
        else:
            xOff=xOff+1.0/totalW
            plotNode(secondDict[key],(xOff,yOff),cntrPt,leafNode)
            plotMidText((xOff,yOff),cntrPt,str(key))
    yOff=yOff+1/totalD
#绘制决策树
def createPlot(inTree):
    plt.rcParams['font.sans-serif']=['SimHei']
    plt.rcParams['axes.unicode_minus']=False
    fig=plt.figure(1,facecolor='white')
    fig.clf()
    axprops=dict(xticks=[],yticks=[])
    global ax
    ax=plt.subplot(111,frameon=False,**axprops)
    global totalW
    totalW=float(getNumLeafs(inTree))
    global totalD
    totalD=float(getTreeDepth(inTree))
    global xOff
    xOff=-0.5/totalW
    global yOff
    yOff=1.0
    plotTree(inTree,(0.5,1.0),'')
    plt.show()


#测试
if __name__=='__main__':
    myData,labels=mytree.createDataSet()
    tree=mytree.createTree(myData,labels)
    tree['能不能浮出水面'][3]='maybe'
    createPlot(tree)
基于决策树预测眼镜类型
1.构建数据集和决策树
#导入科学计算包
from numpy import *
#导入决策树构建算法
import trees as algirothm
#导入绘制决策树
import treePlotter as plt
#处理文本数据
def createDate():
    f=open("D:/学习资料/机器学习实战/《机器学习实战》源代码/machinelearninginaction/Ch03/lenses.txt")
    inst=f.readlines()
    lenses=[]
    for str in inst:
        lenses.append(str.strip("\n").split("\t"))
    lensesLabels=['年龄','症状','是否散光','眼泪数量']
    return lenses,lensesLabels


#测试
if __name__=='__main__':
    myDate,labels=createDate()
    tree=algirothm.createTree(myDate,labels)
    print(tree)
    plt.createPlot(tree)
2.绘制决策树
#导入matplotlb画图包
import matplotlib.pyplot as plt
#导入处理后的决策树数据
import trees as mytree
descisionNode=dict(boxstyle="sawtooth",fc="0.8")
leafNode=dict(boxstyle="round4",fc="0.8")
arrow_args=dict(arrowstyle="<-")
ax=None
totalW=None
totalD=None
xOff=None
yOff=None

#绘制带箭头的注解
def plotNode(nodeTxt,centerPt,parentPt,nodeType):
    ax.annotate(nodeTxt,xy=parentPt,xycoords='axes fraction',xytext=centerPt,textcoords='axes fraction',\
    va="center",ha="center",bbox=nodeType,arrowprops=arrow_args)


#获取叶子节点的数目和树的层次
def getNumLeafs(myTree):
    numLeafs=0
    firStr=list(myTree.keys())[0]
    secondDict=myTree[firStr]
    for key in secondDict.keys():
        if type(secondDict[key]).__name__=='dict':
            numLeafs+=getNumLeafs(secondDict[key])
        else:
            numLeafs+=1
    return numLeafs
#获取树的层次
def getTreeDepth(myTree):
    maxDepth=0
    firstStr=list(myTree.keys())[0]
    secondDict=myTree[firstStr]
    for key in secondDict.keys():
        if type(secondDict[key]).__name__=='dict':
            thisDepth=1+getTreeDepth(secondDict[key])
        else:
            thisDepth=1
        if thisDepth>maxDepth:
            maxDepth=thisDepth
    return maxDepth

#在分支上显示基于特征值划分判断值
def plotMidText(cntrPt,parentPt,txtString):
    xMid=(parentPt[0]-cntrPt[0])/2.0+cntrPt[0]
    yMid=(parentPt[1]-cntrPt[1])/2.0+cntrPt[1]
    ax.text(xMid,yMid,txtString)
#绘制决策树的节点
def plotTree(myTree,parentPt,nodeTxt):
    global yOff
    global xOff
    numLeafs=getNumLeafs(myTree)
    depth=getTreeDepth(myTree)
    firstStr=list(myTree.keys())[0]
    cntrPt=(xOff+float(1+float(numLeafs))/2.0/totalW,yOff)
    plotMidText(cntrPt,parentPt,nodeTxt)
    plotNode(firstStr,cntrPt,parentPt,descisionNode)
    secondDict=myTree[firstStr]
    yOff=yOff-1.0/totalD
    for key in secondDict.keys():
        if type(secondDict[key]).__name__=='dict':
            plotTree(secondDict[key],cntrPt,str(key))
        else:
            xOff=xOff+1.0/totalW
            plotNode(secondDict[key],(xOff,yOff),cntrPt,leafNode)
            plotMidText((xOff,yOff),cntrPt,str(key))
    yOff=yOff+1/totalD
#绘制决策树
def createPlot(inTree):
    plt.rcParams['font.sans-serif']=['SimHei']
    plt.rcParams['axes.unicode_minus']=False
    fig=plt.figure(1,facecolor='white')
    fig.clf()
    axprops=dict(xticks=[],yticks=[])
    global ax
    ax=plt.subplot(111,frameon=False,**axprops)
    global totalW
    totalW=float(getNumLeafs(inTree))
    global totalD
    totalD=float(getTreeDepth(inTree))
    global xOff
    xOff=-0.5/totalW
    global yOff
    yOff=1.0
    plotTree(inTree,(0.5,1.0),'')
    plt.show()


#测试
if __name__=='__main__':
    myData,labels=mytree.createDataSet()
    tree=mytree.createTree(myData,labels)
    tree['能不能浮出水面'][3]='maybe'
    createPlot(tree)

总结
以上案例都是基于信息增益来选择划分数据集的特征,这种算法被称为ID3,选择划分数据集的特也可以基于基尼指数的CART算法,基于信息增益率的C4.5算法